


Mutational Signatures (v3.4 - October 2023)
DBS3 · GRCh37 · COSMIC v99
Mutational profile

Genome: GRCh37

Genome: GRCh38

Genome: mm9

Genome: mm10

Genome: rn6
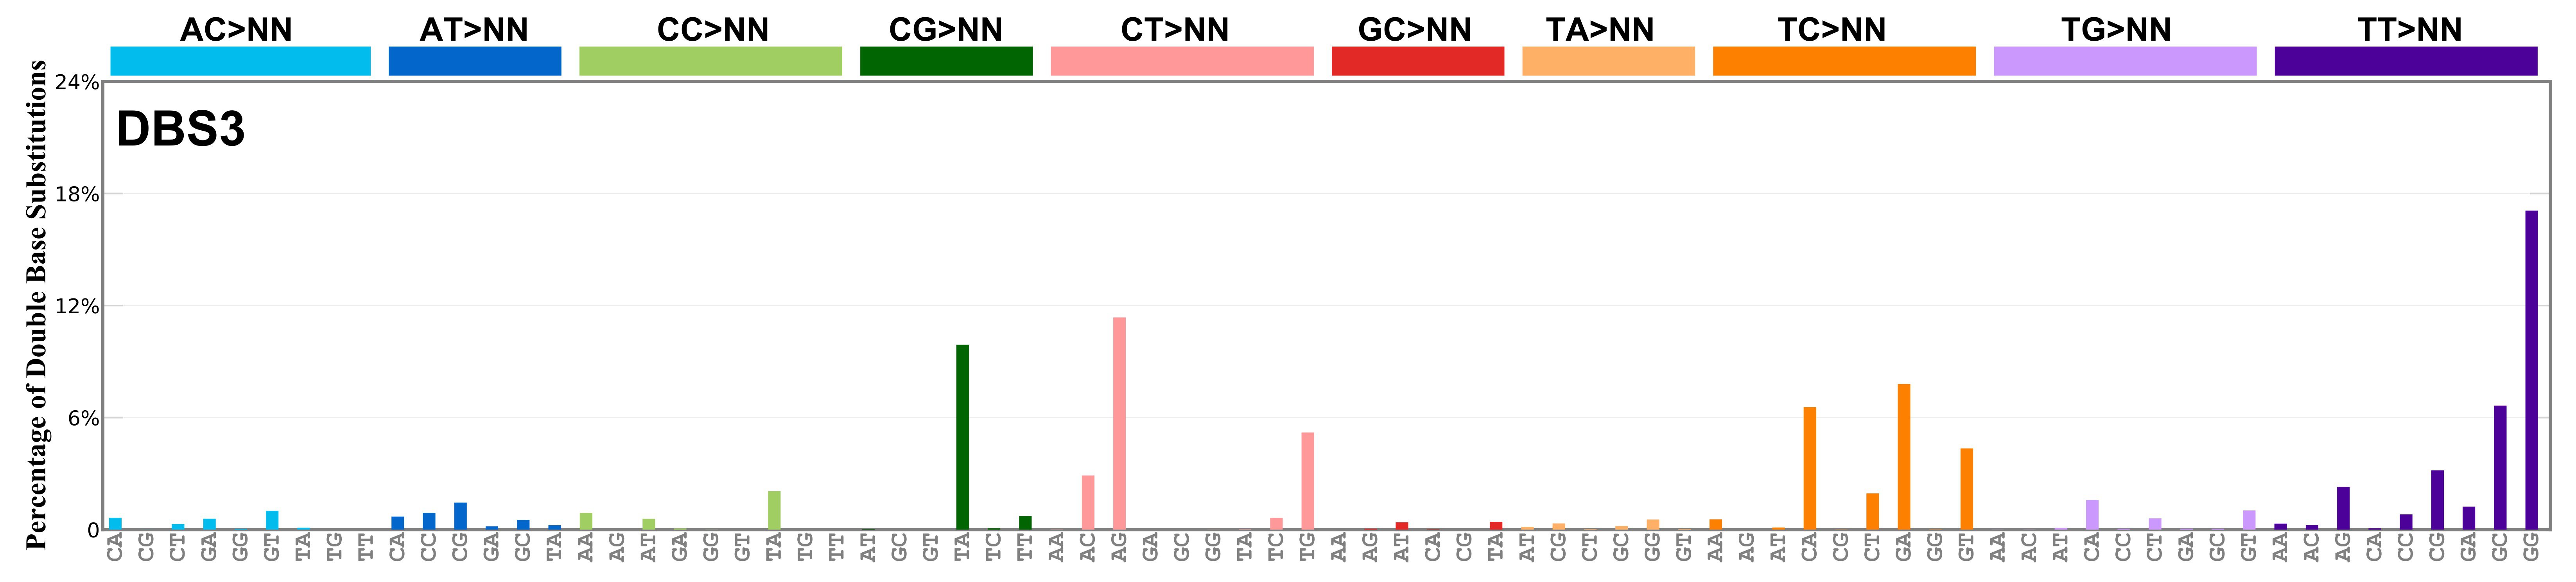
Proportion of a particular doublet base substitution (DBS) mutation type among all DBS mutation types in the signature is represented by the height of each bar. There are 78 strand-agnostic DBS mutation types.
The reason there are 78 strand-agnostic DBS mutation types is as follows. First, there are 4 x 4 = 16 possible source doublet bases. Of these, AT, TA, CG, and GC are their own reverse complement. We can represent the remaining 12 as 6 possible strand-agnostic doublets (e.g. AC represents both AC and its reverse complement, GT). Thus, there are 4+6=10 source doublet bases. Because they are their own reverse complements, AT, TA, CG, and GC can each be substituted by only 6 doublets . For example, AT can be substituted by 3 doublets starting with C: CA, CC, CG. But AT can be substituted by only 2 doublets starting with G: GA and GC. This is because the mutation from AT>GG is already represented by its reverse complement, AT>CC. Similarly AT can be substituted by only 1 doublet starting with T: TA. This is because AT>TC is represented by its reverse complement, AT>GA, and AT>TG is represented by AT>CA. For the remaining doublets, which are not their own reverse-complements, there are 3 x 3 = 9 possible DBS mutation types. Thus, in total there are 4 x 6 + 6 x 9 = 78 strand-agnostic DBS mutation types (see enumeration in the accompanying Excel document).
Proposed aetiology
Polymerase epsilon exonuclease domain mutations.
Acceptance criteria
| Background | Identification study | First included in COSMIC | |
|---|---|---|---|
| Alexandrov et al. 2020 Nature | v3 | ||
| Identification | NGS technique | Different variant callers | Multiple sequencing centres |
| WGS | Yes | Yes | |
| Technical validation | Validated in orthogonal techniques | Replicated in additional studies | Extended context enrichment |
| Yes | Yes | - | |
| Proposed aetiology | Mutational process | Support | |
| POLE exonuclease domain mutation | Statistical association | ||
| Experimental validation | Experimental study | Species | |
| - | - | ||
Summary of the technical and experimental evidence available in the scientific literature regarding the validation of the mutational signature.
Tissue distribution
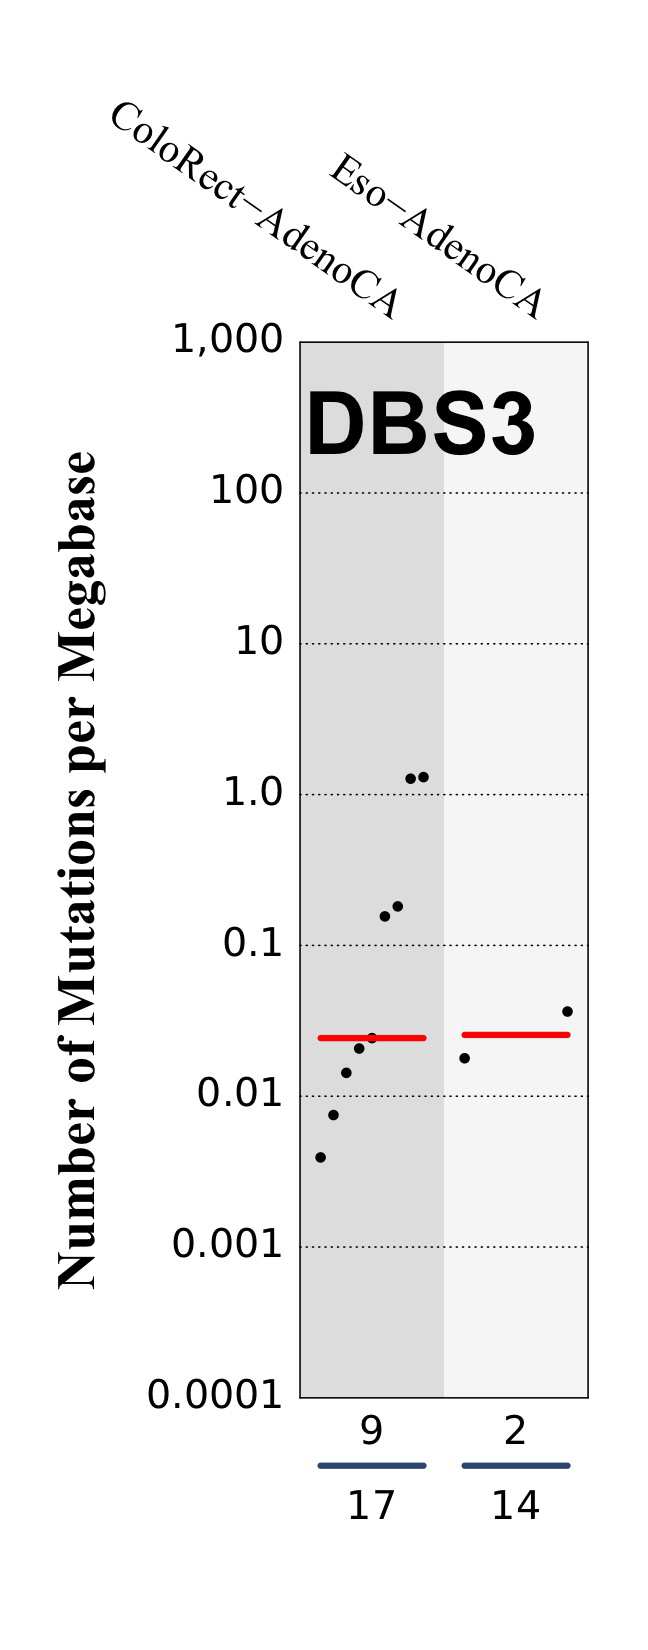
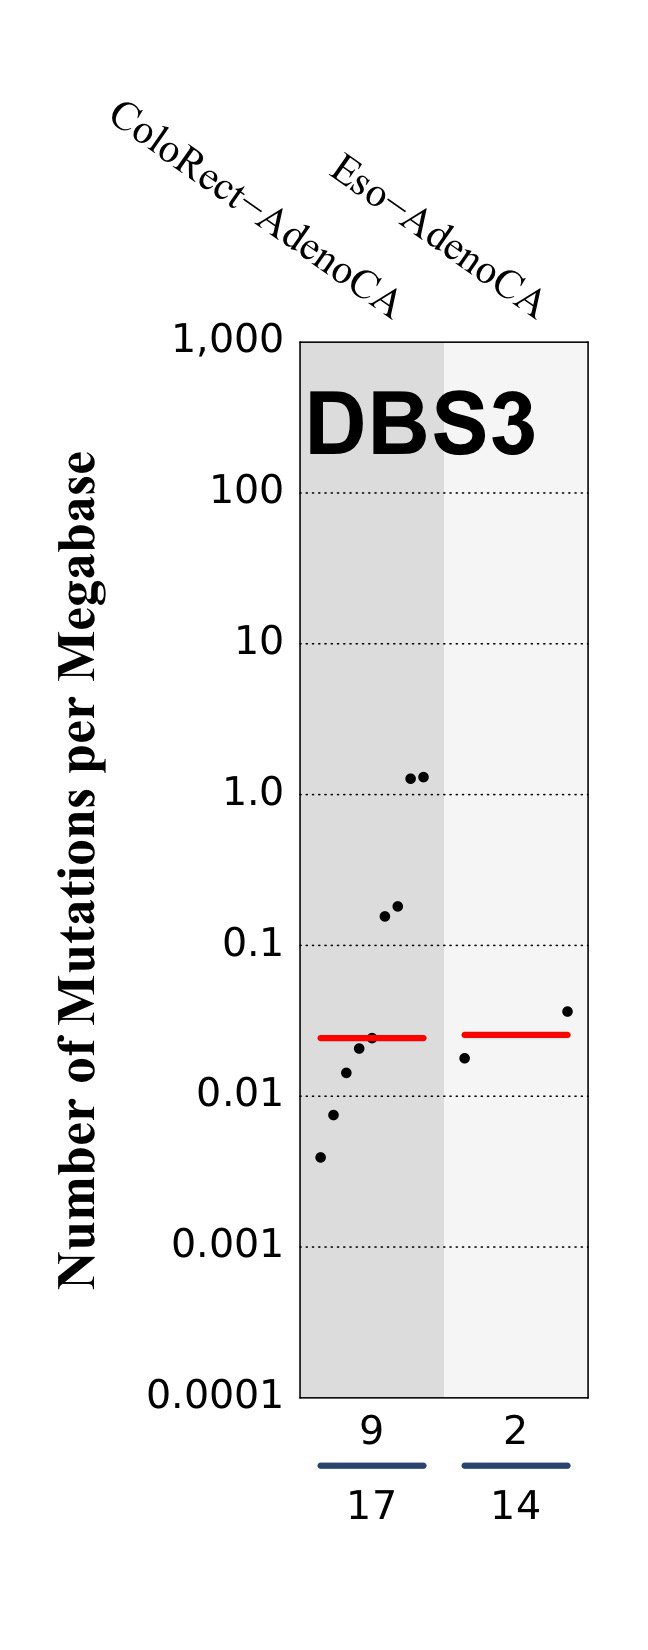
Numbers of mutations per megabase attributed to the mutational signature across the cancer types in which the signature was found. Each dot represents an individual sample and only samples where the signature is found are shown. The number of mutations per megabase was calculated by assuming that an average whole-exome has 30 Mb with sufficient coverage, whereas an average whole-genome has 2,800 Mb with sufficient coverage.
The numbers below the dots for each cancer type indicate the number of high confidence tumours in which the signature was attributed (above the blue horizontal line) and the total number of high confidence tumours analysed (below the blue horizontal line). Only high confidence data are displayed: samples with reconstruction accuracy >0.90.
Associated signatures
DBS3 is associated with SBS10a/SBS10b, albeit it is not found in all samples where these signatures are present.
Replication timing

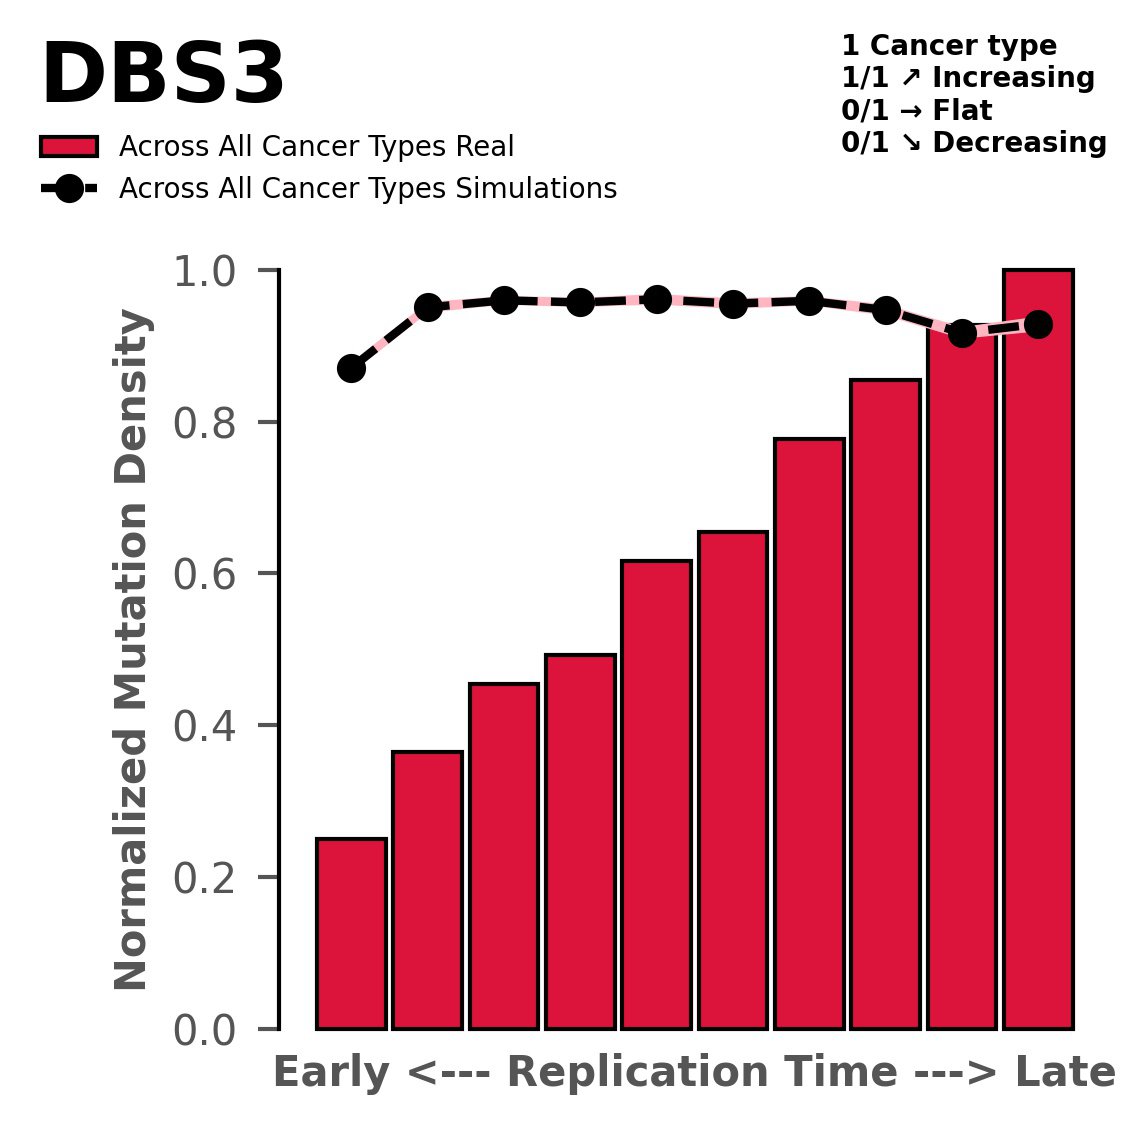
Tissue: aggregated across 1 tissues

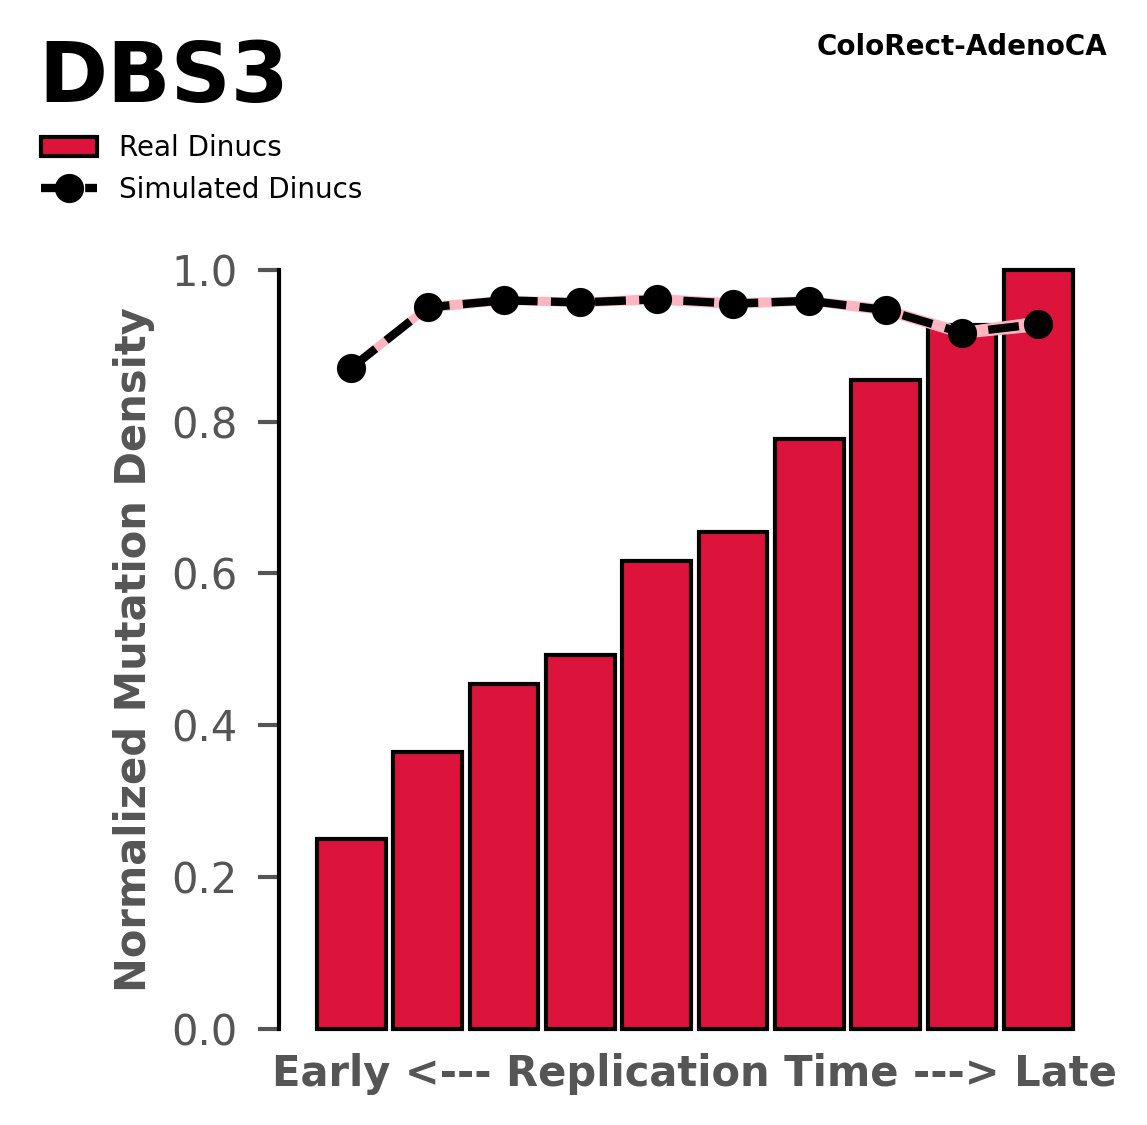
Tissue: ColoRect-AdenoCA (Colorectal Adenocarcinoma)
Normalised mutational densities from early to late replicating regions in the human genome are shown with respect to real somatic mutations and simulated mutations. The dashed line reflects the behaviour of simulated mutations, whereas the bars represent the behaviour for real somatic mutations.
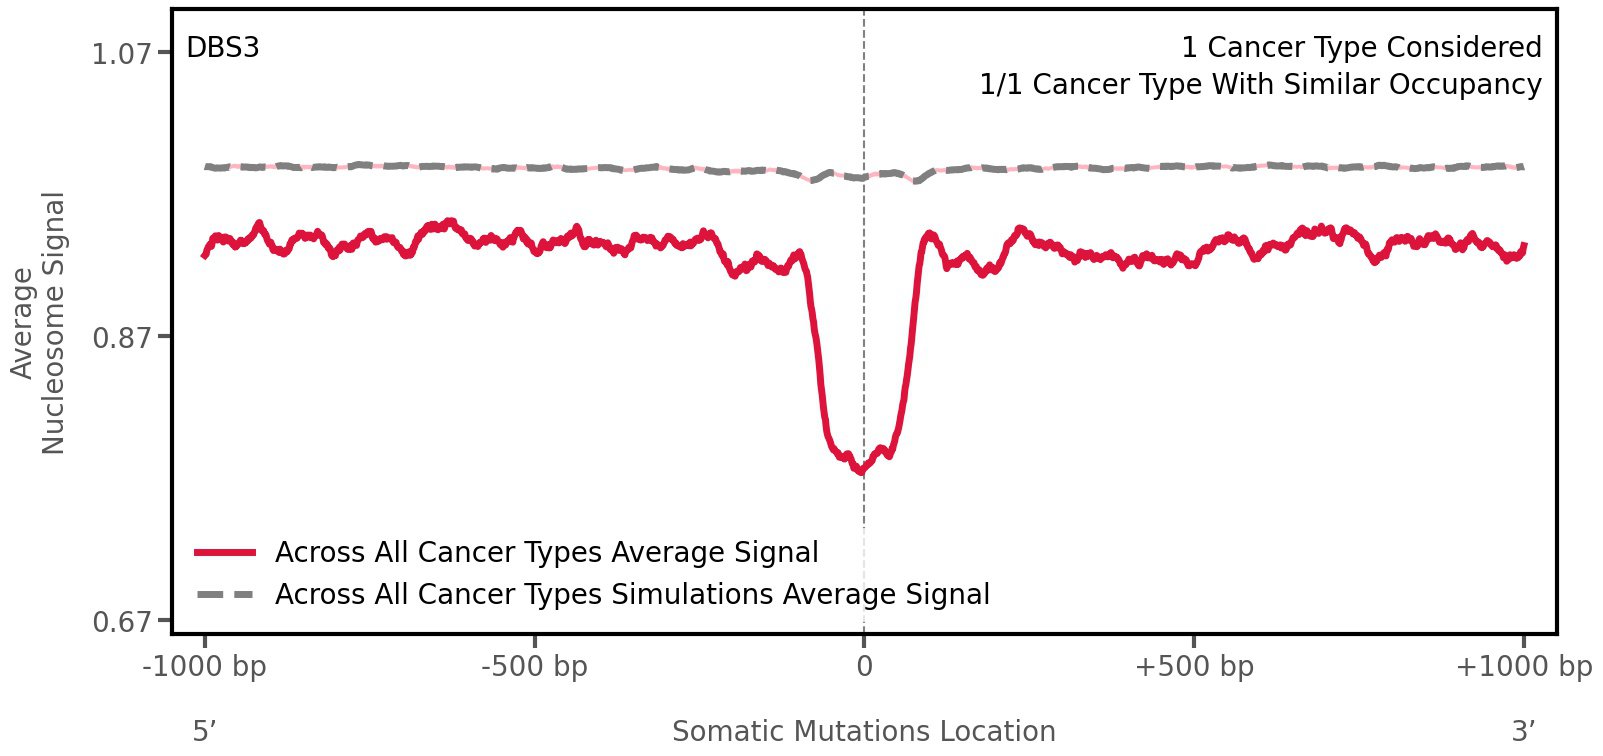
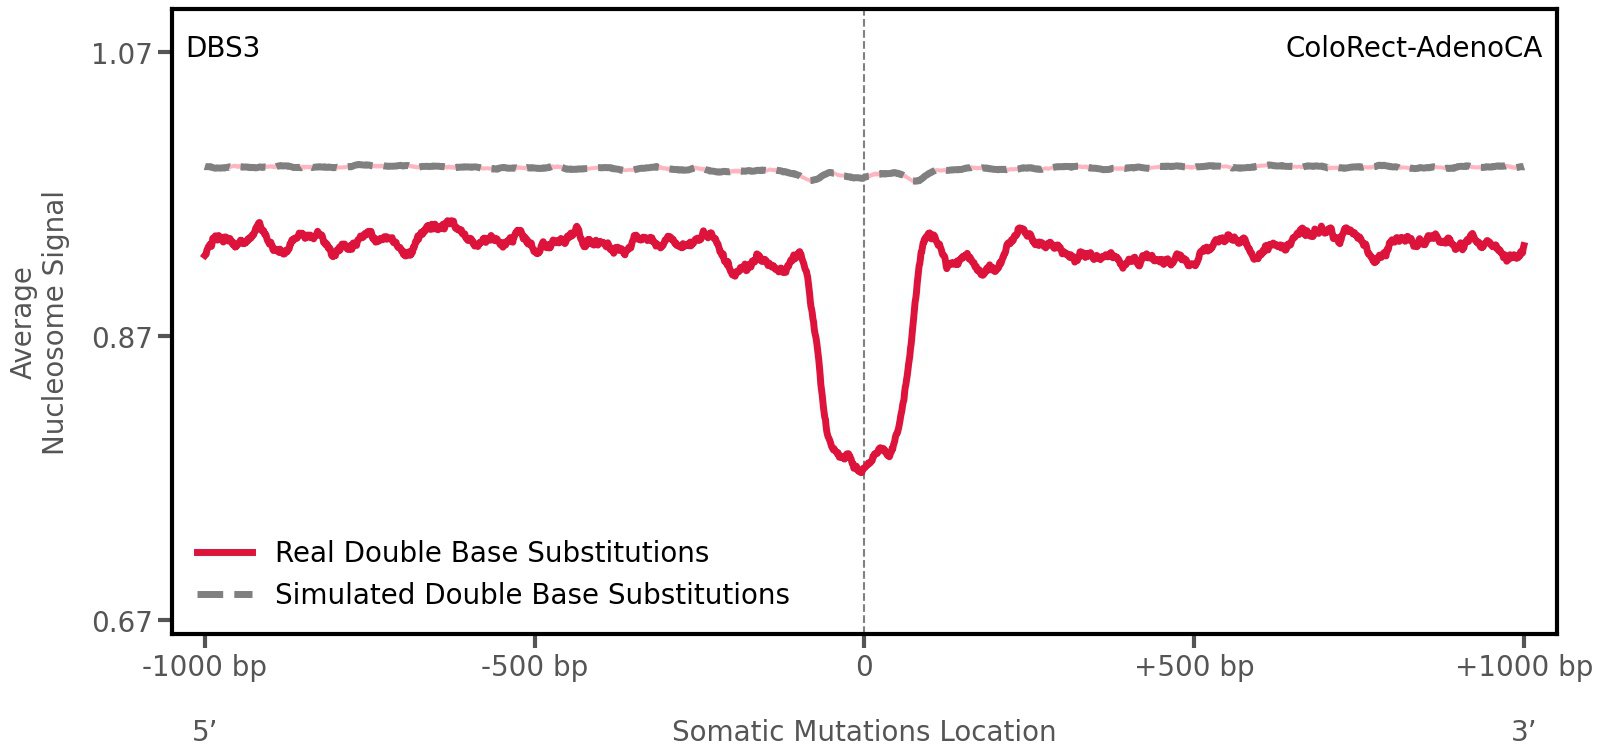
Nucleosome occupancy

Tissue: aggregated across 1 tissues

Tissue: ColoRect-AdenoCA (Colorectal Adenocarcinoma)
Average nucleosome signal along a 2 kilobase window centred at the somatic mutation (dashed vertical line). The solid blue line shows the average nucleosome signal for real mutations, whereas the dashed line shows the average nucleosome signal for simulated somatic mutations. A higher signal reflects a higher propensity for nucleosome occupancy.
CTCF occupancy
Topography analysis could not be performed for CTCF occupancy as the number of mutations satisfying our constraints was insufficient or this signature was not yet analysed.
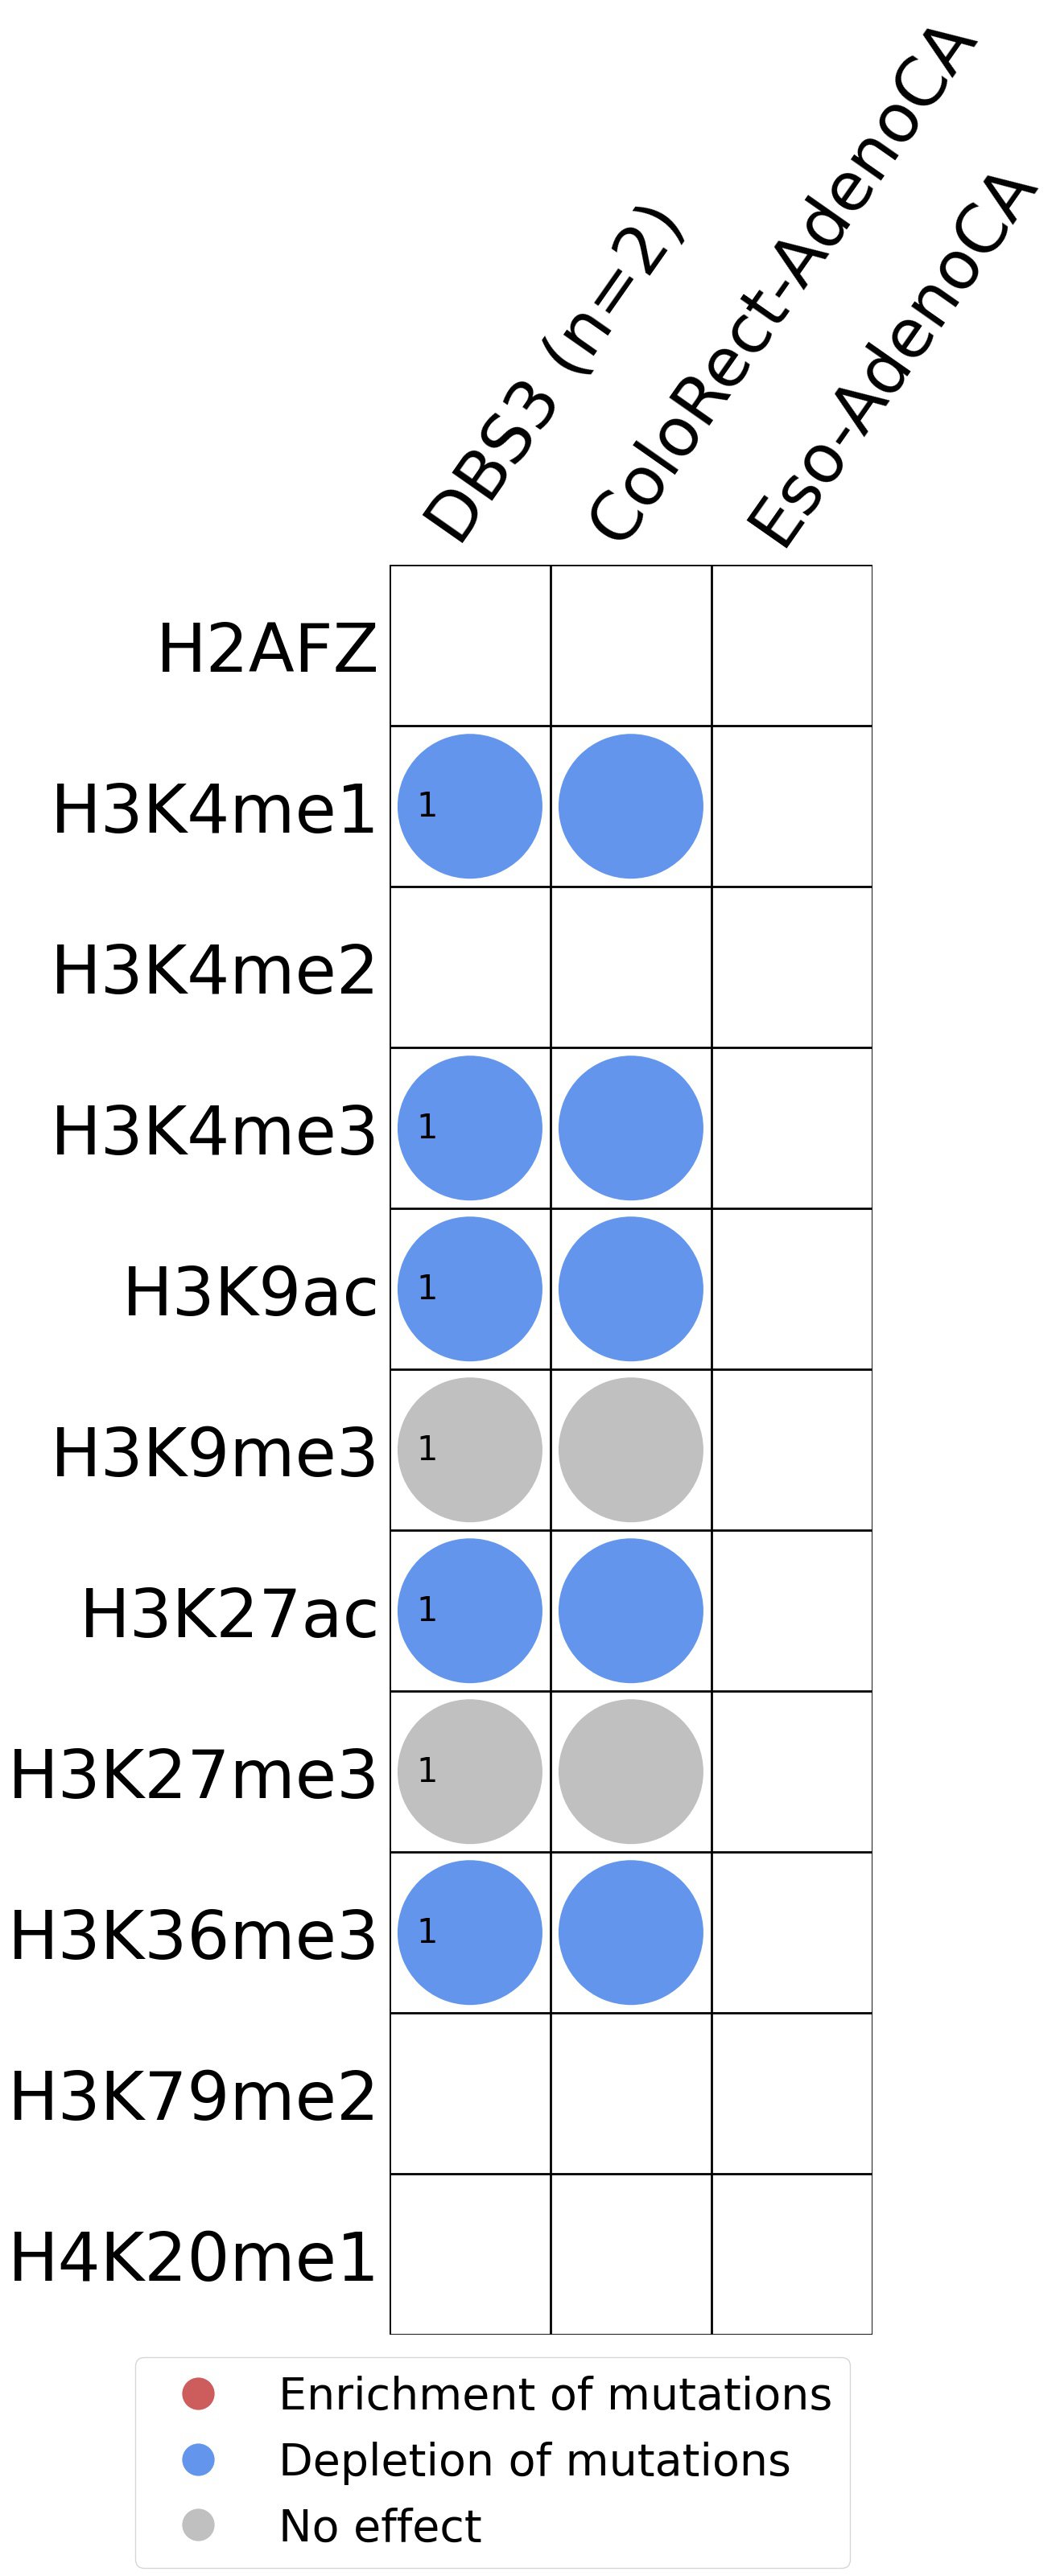
Histone modifications

This plot shows the associations between mutational signatures and histone marks. Pie charts display the number of cancer types that are either enriched, depleted, or have no statistical effect for a given mutational signature and a specific histone mark. Differential changes are calculated by statistically comparing the of average signals between real and simulated mutations using a 100 base window centered at the somatic mutation. Enrichments reflect at least 5% statistically significant increases in real signal when compared to simulated signal. Depletions reflect at least 5% statistically significant decreases in real signal when compared to simulated signal. Statistical significance is determined based on false-discovery rate corrected p-value below 0.05.
(i) H2AFZ, a replication-independent member of the histone H2A family that renders chromatin accessible at enhancers and promoters and regulates transcriptional activation and repression; (ii) H3K4me1, histone mark often associated with enhancer activity; (iii) H3K4me2, a histone post-translational modification enriched in cis-regulatory regions, including both enhancers and promoters; (iv) H3K4me3, post-translational modification enriched in active promoters near transcription start sites; (v) H3K9ac, associated with active gene promoters and active transcription; (vi) H3K9me3, typical mark of constitutive heterochromatin; (vii) H3K27ac, histone modification generally contained at nucleosomes flanking enhancers; (viii) H3K27me3, repressive, associated with silent genes; (ix) H3K36me3, associated with transcribed regions and playing a role in regulating DNA damage repair; (x) H3K79me2, detected in the transcribed regions of active genes; and (xi) H4K20me1, found in gene promoters and associated with gene transcriptional elongation and transcription activation.
Transcriptional strand asymmetry
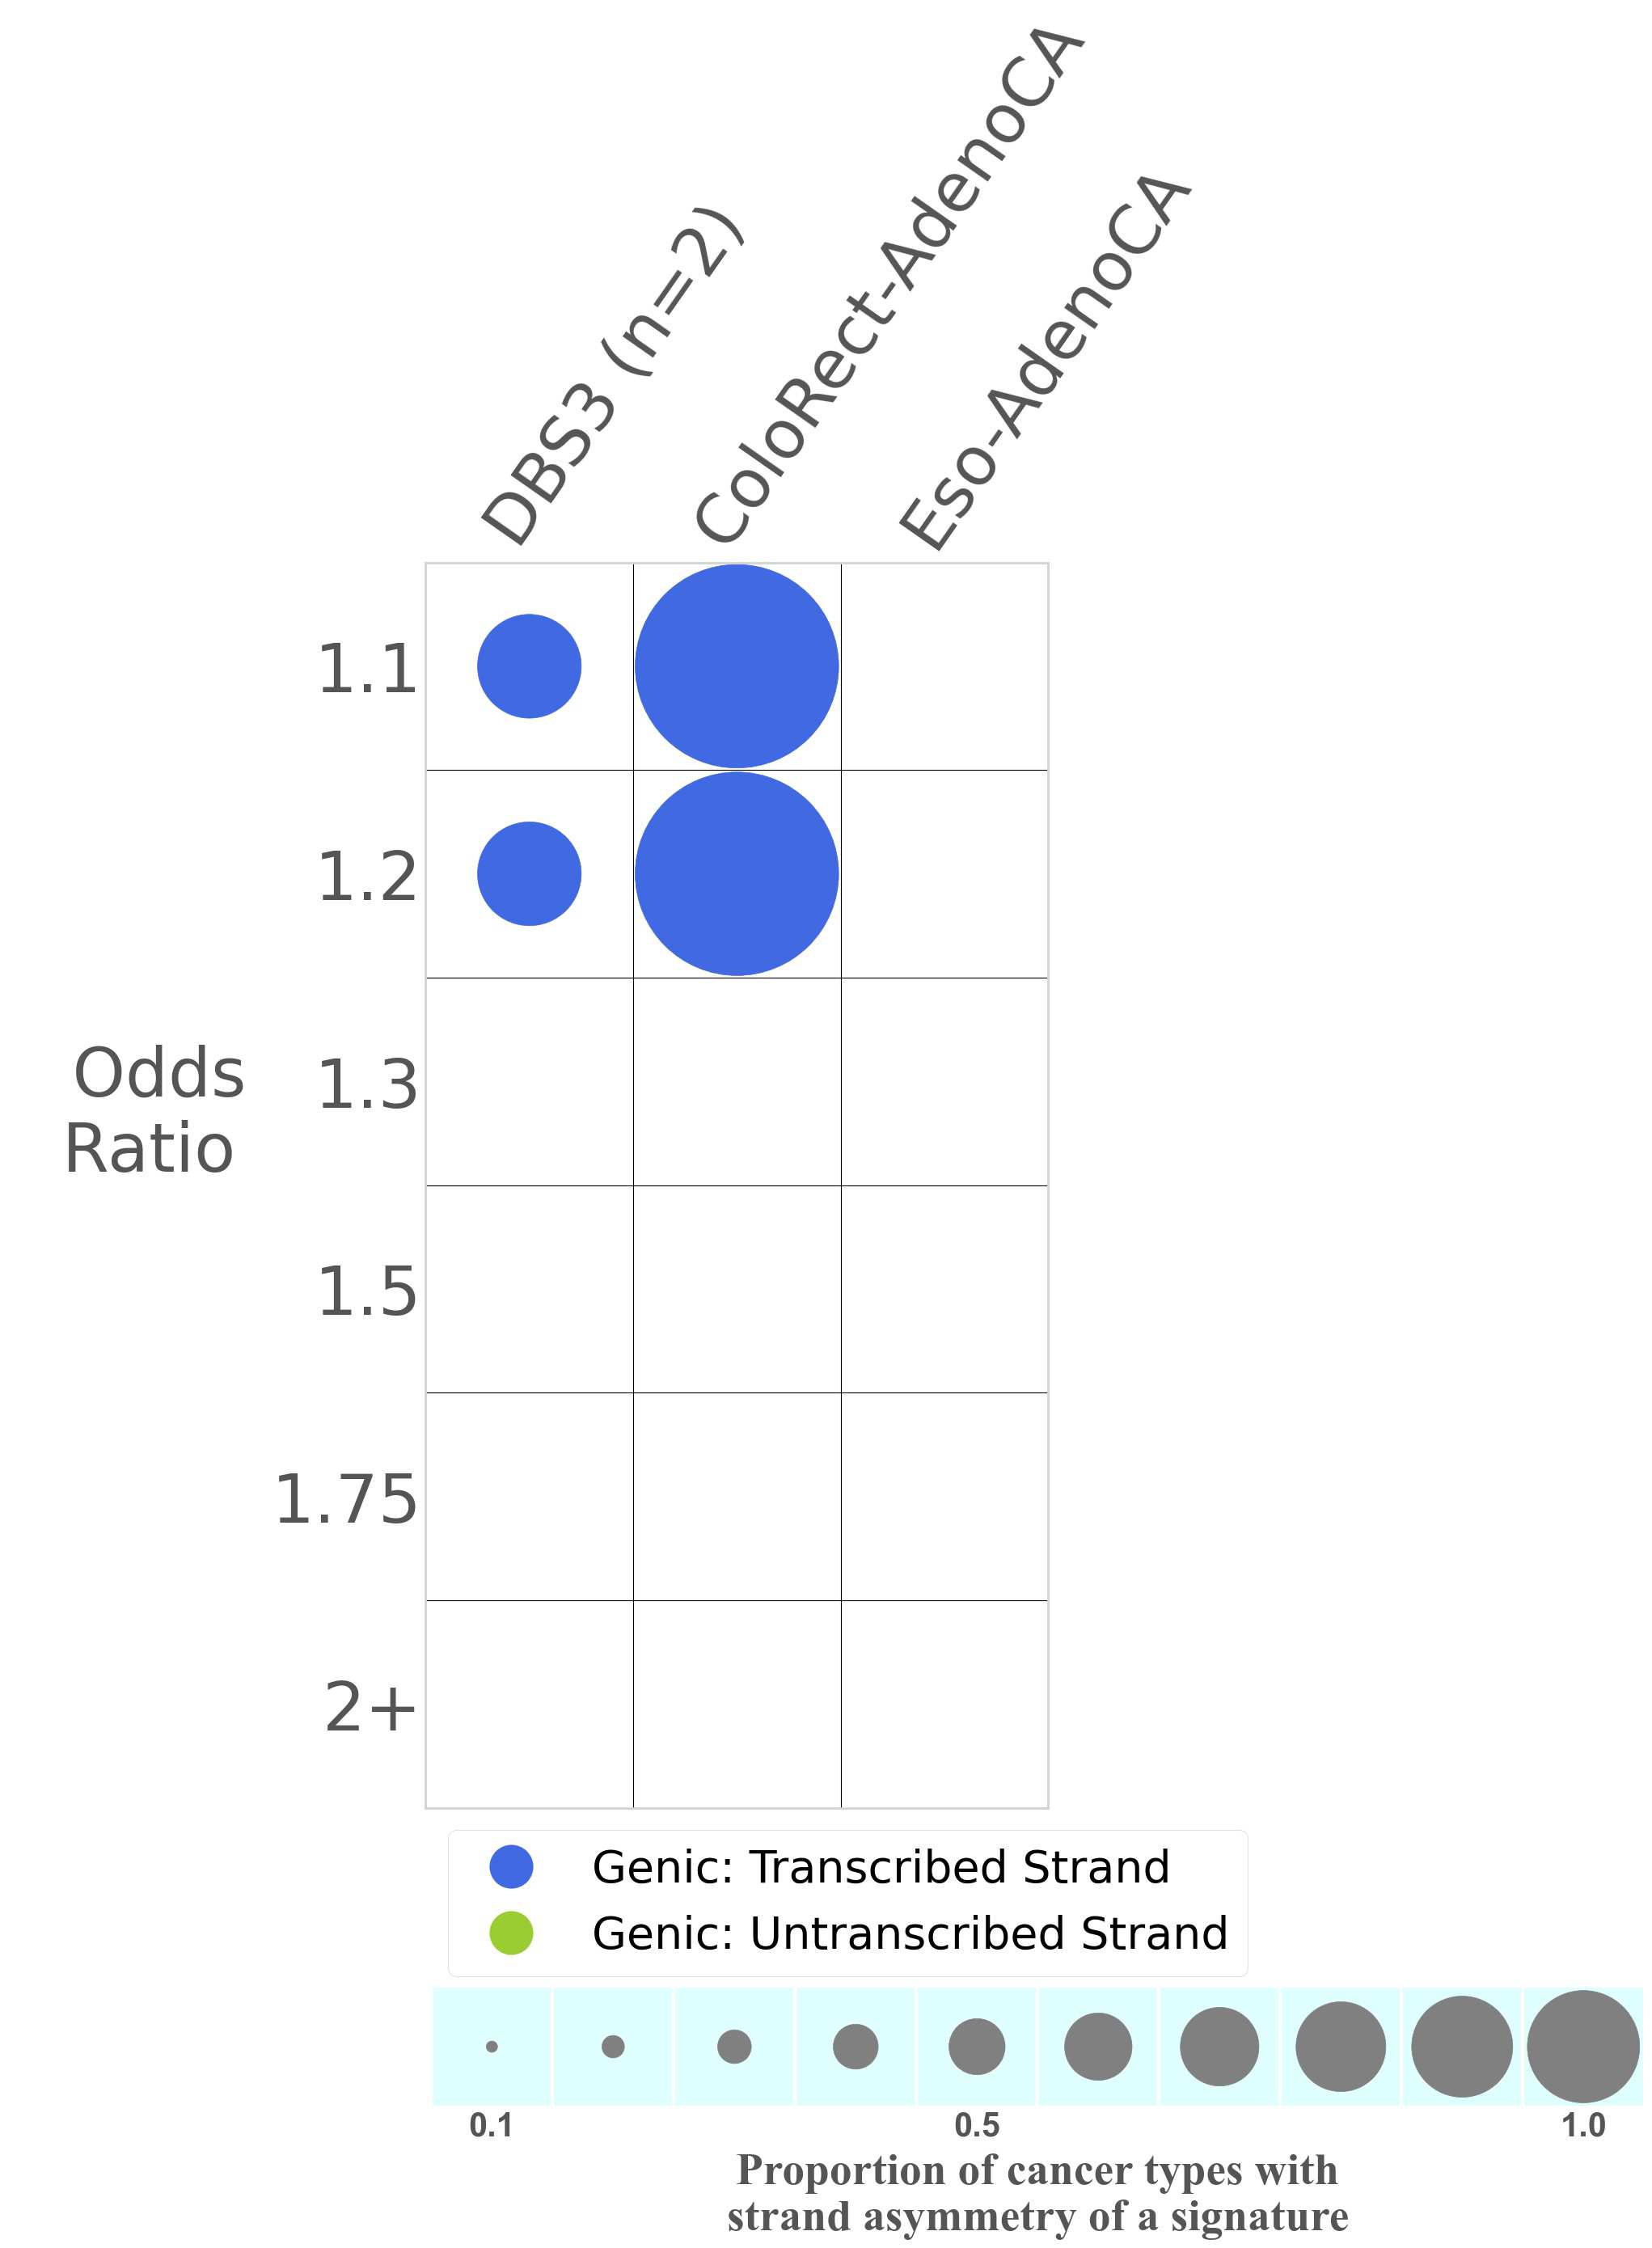
Mutational signatures exhibit asymmetric number of mutations due to either one of the DNA strands being preferentially repaired or one of the DNA strands having a higher propensity for being damaged. One common example of strand asymmetry is transcription-strand asymmetry which can be due to the activity of transcription-coupled nucleotide excision repair (TC-NER) or transcription-coupled damage amongst others.
The upper bar plot represents the percentage of real mutations in transcribed and untranscribed strands averaged across the human genome as well as all examined samples in 96 mutational context.
In the lower circle plot, the circles are filled with the colour of the significant strand when there is an odds ratio of at least 1.1 with statistical significance. The first row of this plot displays the transcriptional strand asymmetry across all cancer types, while the remaining rows present transcriptional strand asymmetry for each cancer type.
Each mutation attributed to the mutational signature is annotated as either on the transcribed strand, untranscribed strand, or non-transcribed strand.
The odds ratio is defined as the real mutations ratio divided by the simulated mutations ratio, where each ratio is calculated using the number of mutations on transcribed and untranscribed strands. And the number of real mutations on transcribed and untranscribed strands must be statistically significant with respect to the average number of simulated mutations on transcribed and untranscribed strands.
The strand with the higher number of real mutations defines the numerator of both the real mutations ratio and the simulated mutations ratio.
The strand with the lower number of real mutations defines the denominator of both the real mutations ratio and the simulated mutations ratio.
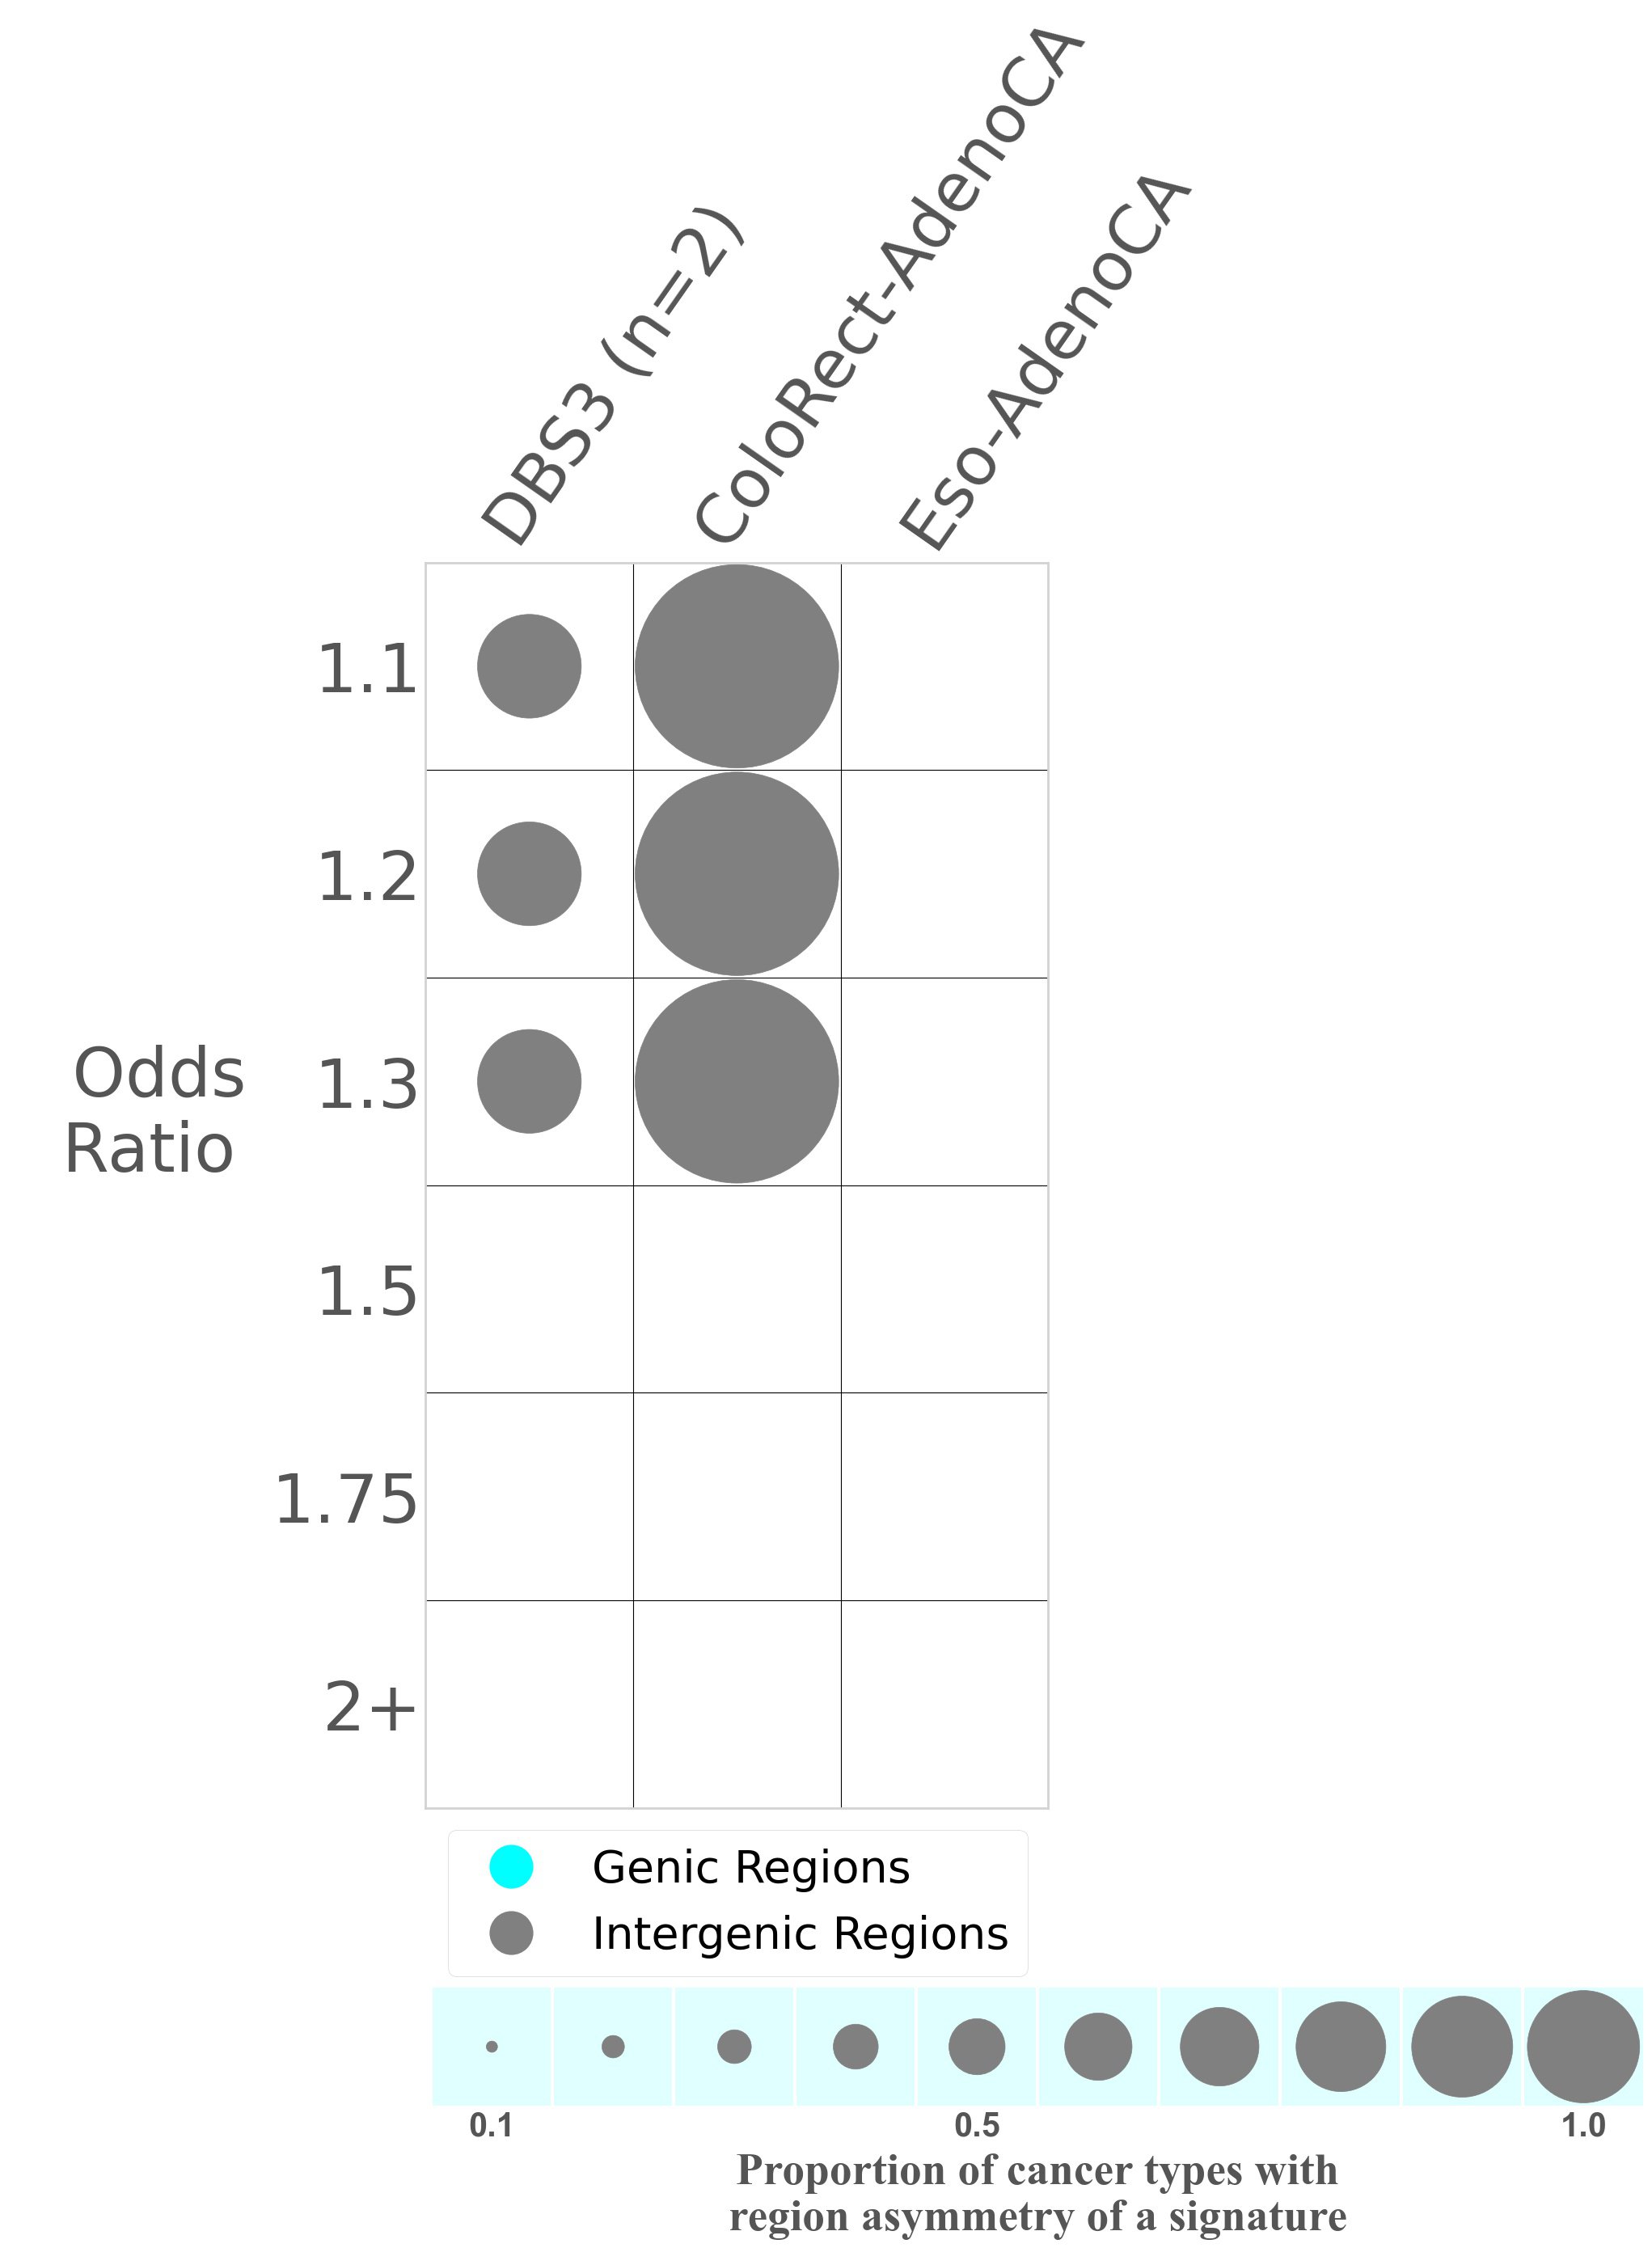
Genic and intergenic regions
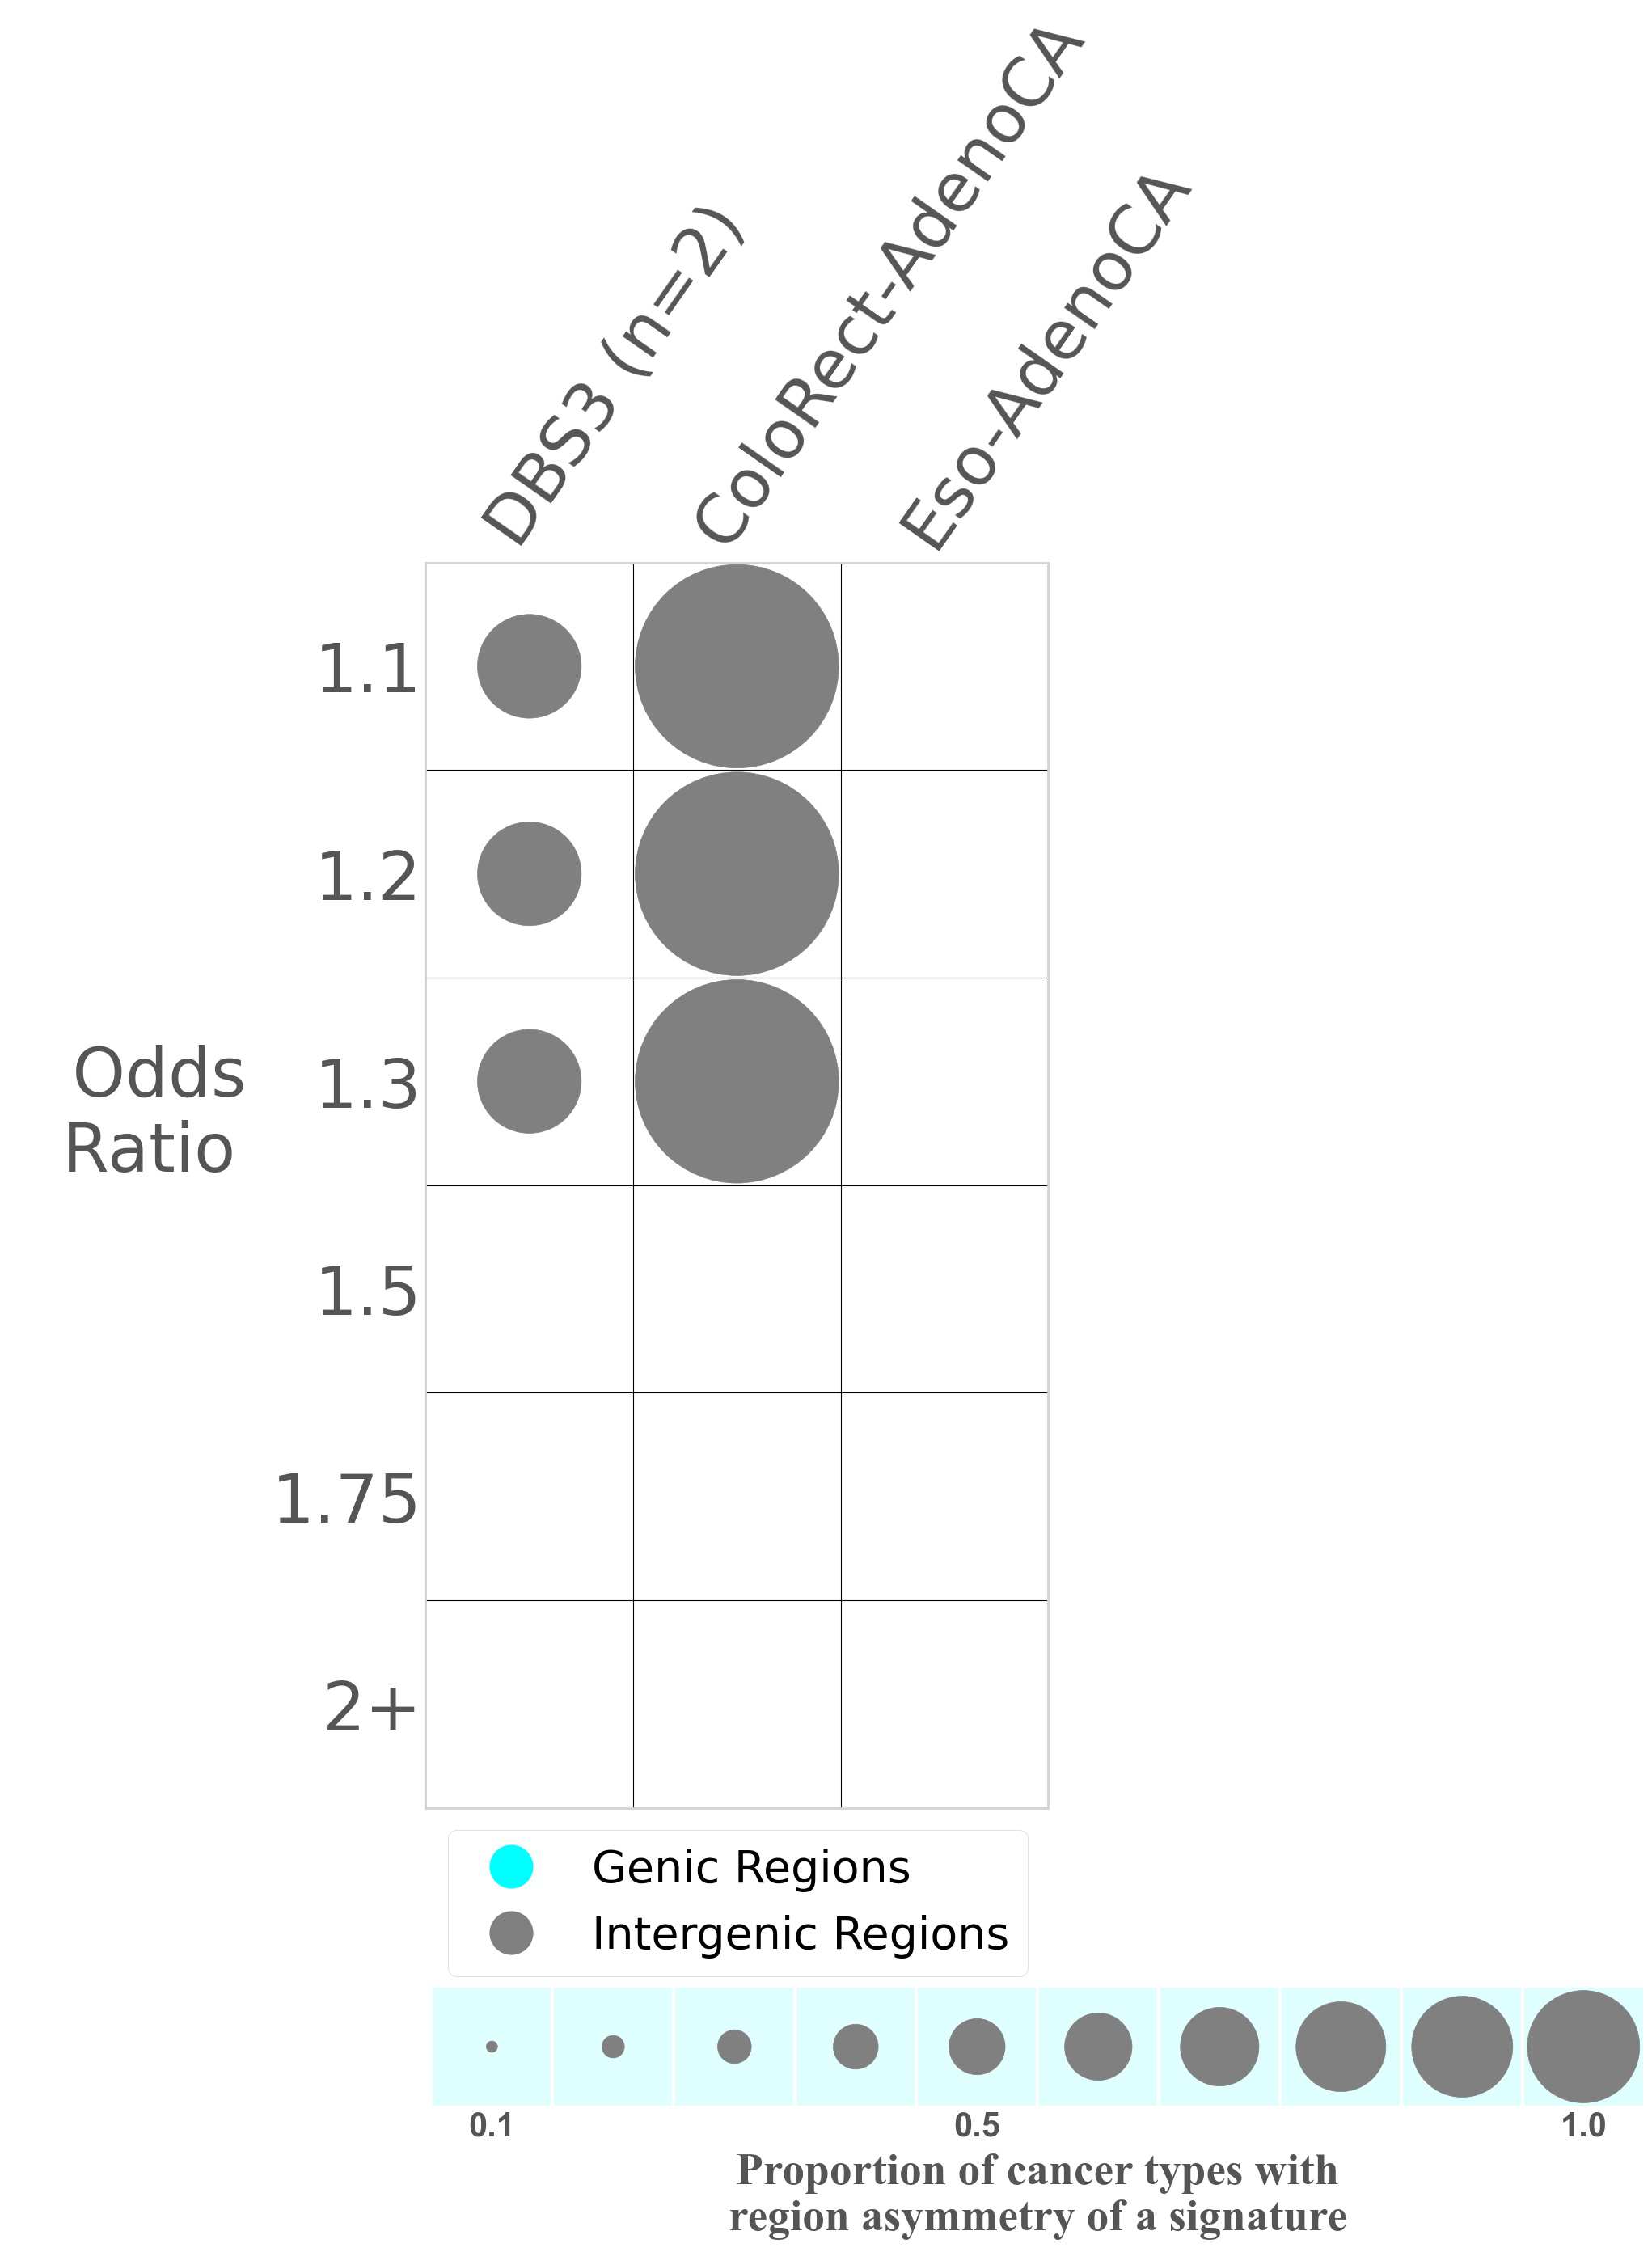
Mutational signatures can leave their mark in the form of differential mutational frequencies between the two DNA regions: genic regions and intergenic regions.
The upper bar plot represents the percentage of real mutations in genic and intergenic regions averaged across the human genome as well as all examined samples in 96 mutational context.
In the lower circle plot, the circles are filled with the colour of the significant region when there is an odds ratio of at least 1.1 with statistical significance. The first row of this plot displays the genic versus intergenic region asymmetry across all cancer types, while the remaining rows present genic versus intergenic region asymmetry for each cancer type.
Each mutation attributed to the mutational signature is annotated as either on the genic region (transcribed strand or untranscribed strand) or intergenic region (non-transcribed strand).
The odds ratio is defined as the real mutations ratio divided by the simulated mutations ratio, where each ratio is calculated using the number of mutations on genic and intergenic regions. And the number of real mutations on genic and intergenic regions must be statistically significant with respect to the average number of simulated mutations on genic and intergenic regions.
The region with the higher number of real mutations defines the numerator of both the real mutations ratio and the simulated mutations ratio.
The region with the lower number of real mutations defines the denominator of both the real mutations ratio and the simulated mutations ratio.
Replicational strand asymmetry
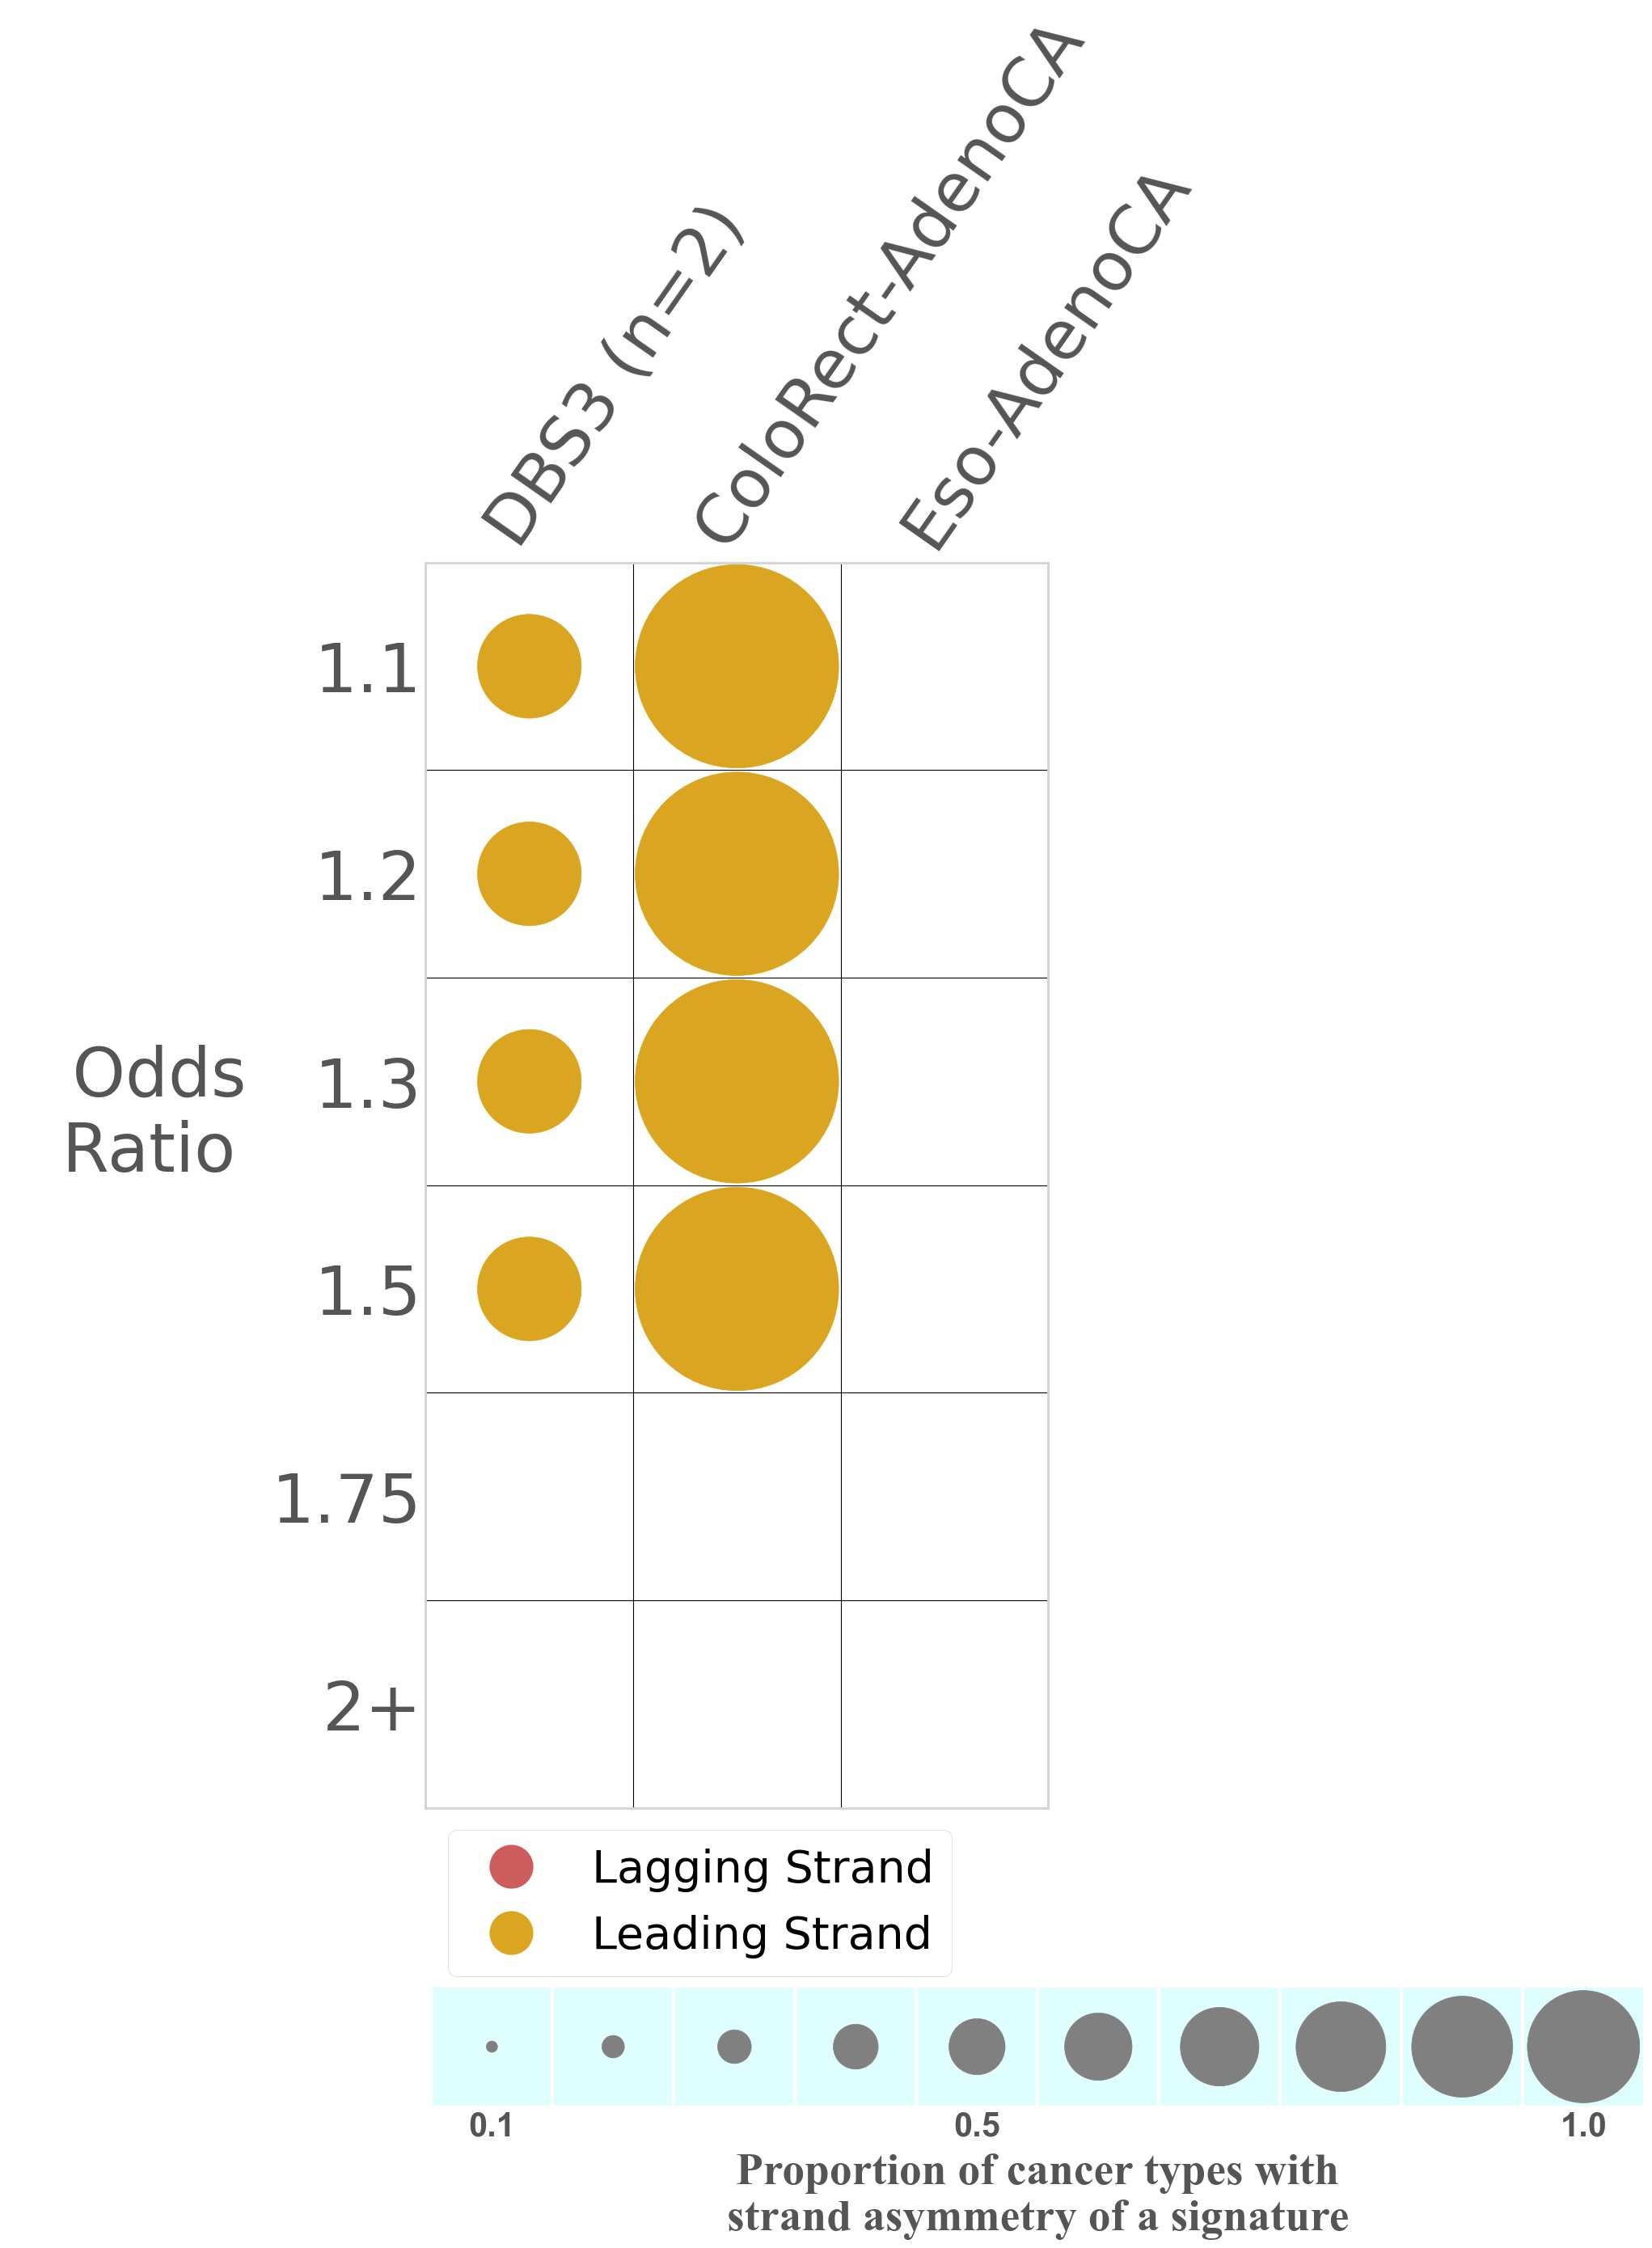
Mutational signatures exhibit asymmetric number of mutations due to either one of the DNA strands being preferentially repaired or one of the DNA strands having a higher propensity for being damaged. One common example of strand asymmetry is replication-strand asymmetry in which the DNA replication process may result in preferential mutagenesis of one of the strands.
The upper bar plot represents the percentage of real mutations in lagging and leading strands averaged across the human genome as well as all examined samples in 96 mutational context.
In the lower circle plot, the circles are filled with the colour of the significant strand when there is an odds ratio of at least 1.1 with statistical significance. The first row of this plot displays the replicational strand asymmetry across all cancer types, while the remaining rows present replicational strand asymmetry for each cancer type.
Each mutation attributed to the mutational signature is annotated as either on the lagging strand or the leading strand.
The odds ratio is defined as the real mutations ratio divided by the simulated mutations ratio, where each ratio is calculated using the number of mutations on lagging and leading strands. And the number of real mutations on lagging and leading strands must be statistically significant with respect to the average number of simulated mutations on lagging and leading strands.
The strand with the higher number of real mutations defines the numerator of both the real mutations ratio and the simulated mutations ratio.
The strand with the lower number of real mutations defines the denominator of both the real mutations ratio and the simulated mutations ratio.