

Whether you are of the opinion that RGB is a complete waste of time or that it's the best thing since sliced bread, one thing is for sure, it stops being regarded as merely a gimmick when one of the big companies takes it on-board. Kingston's latest SSD, the HyperX Fury RGB supports, as its name suggests, RGB lighting.
The HyperX Fury name might jog a few memories as it was a family of SSD's Kingston brought out back in 2014 using a SandForce SF-2281 controller combined with 20nm planar MLC NAND. However besides the twinkly bits the 2018 version of the HyperX Fury uses a Marvell 88SS1074 controller with the latest Toshiba 64-layer BiCS3 3D TLC NAND.
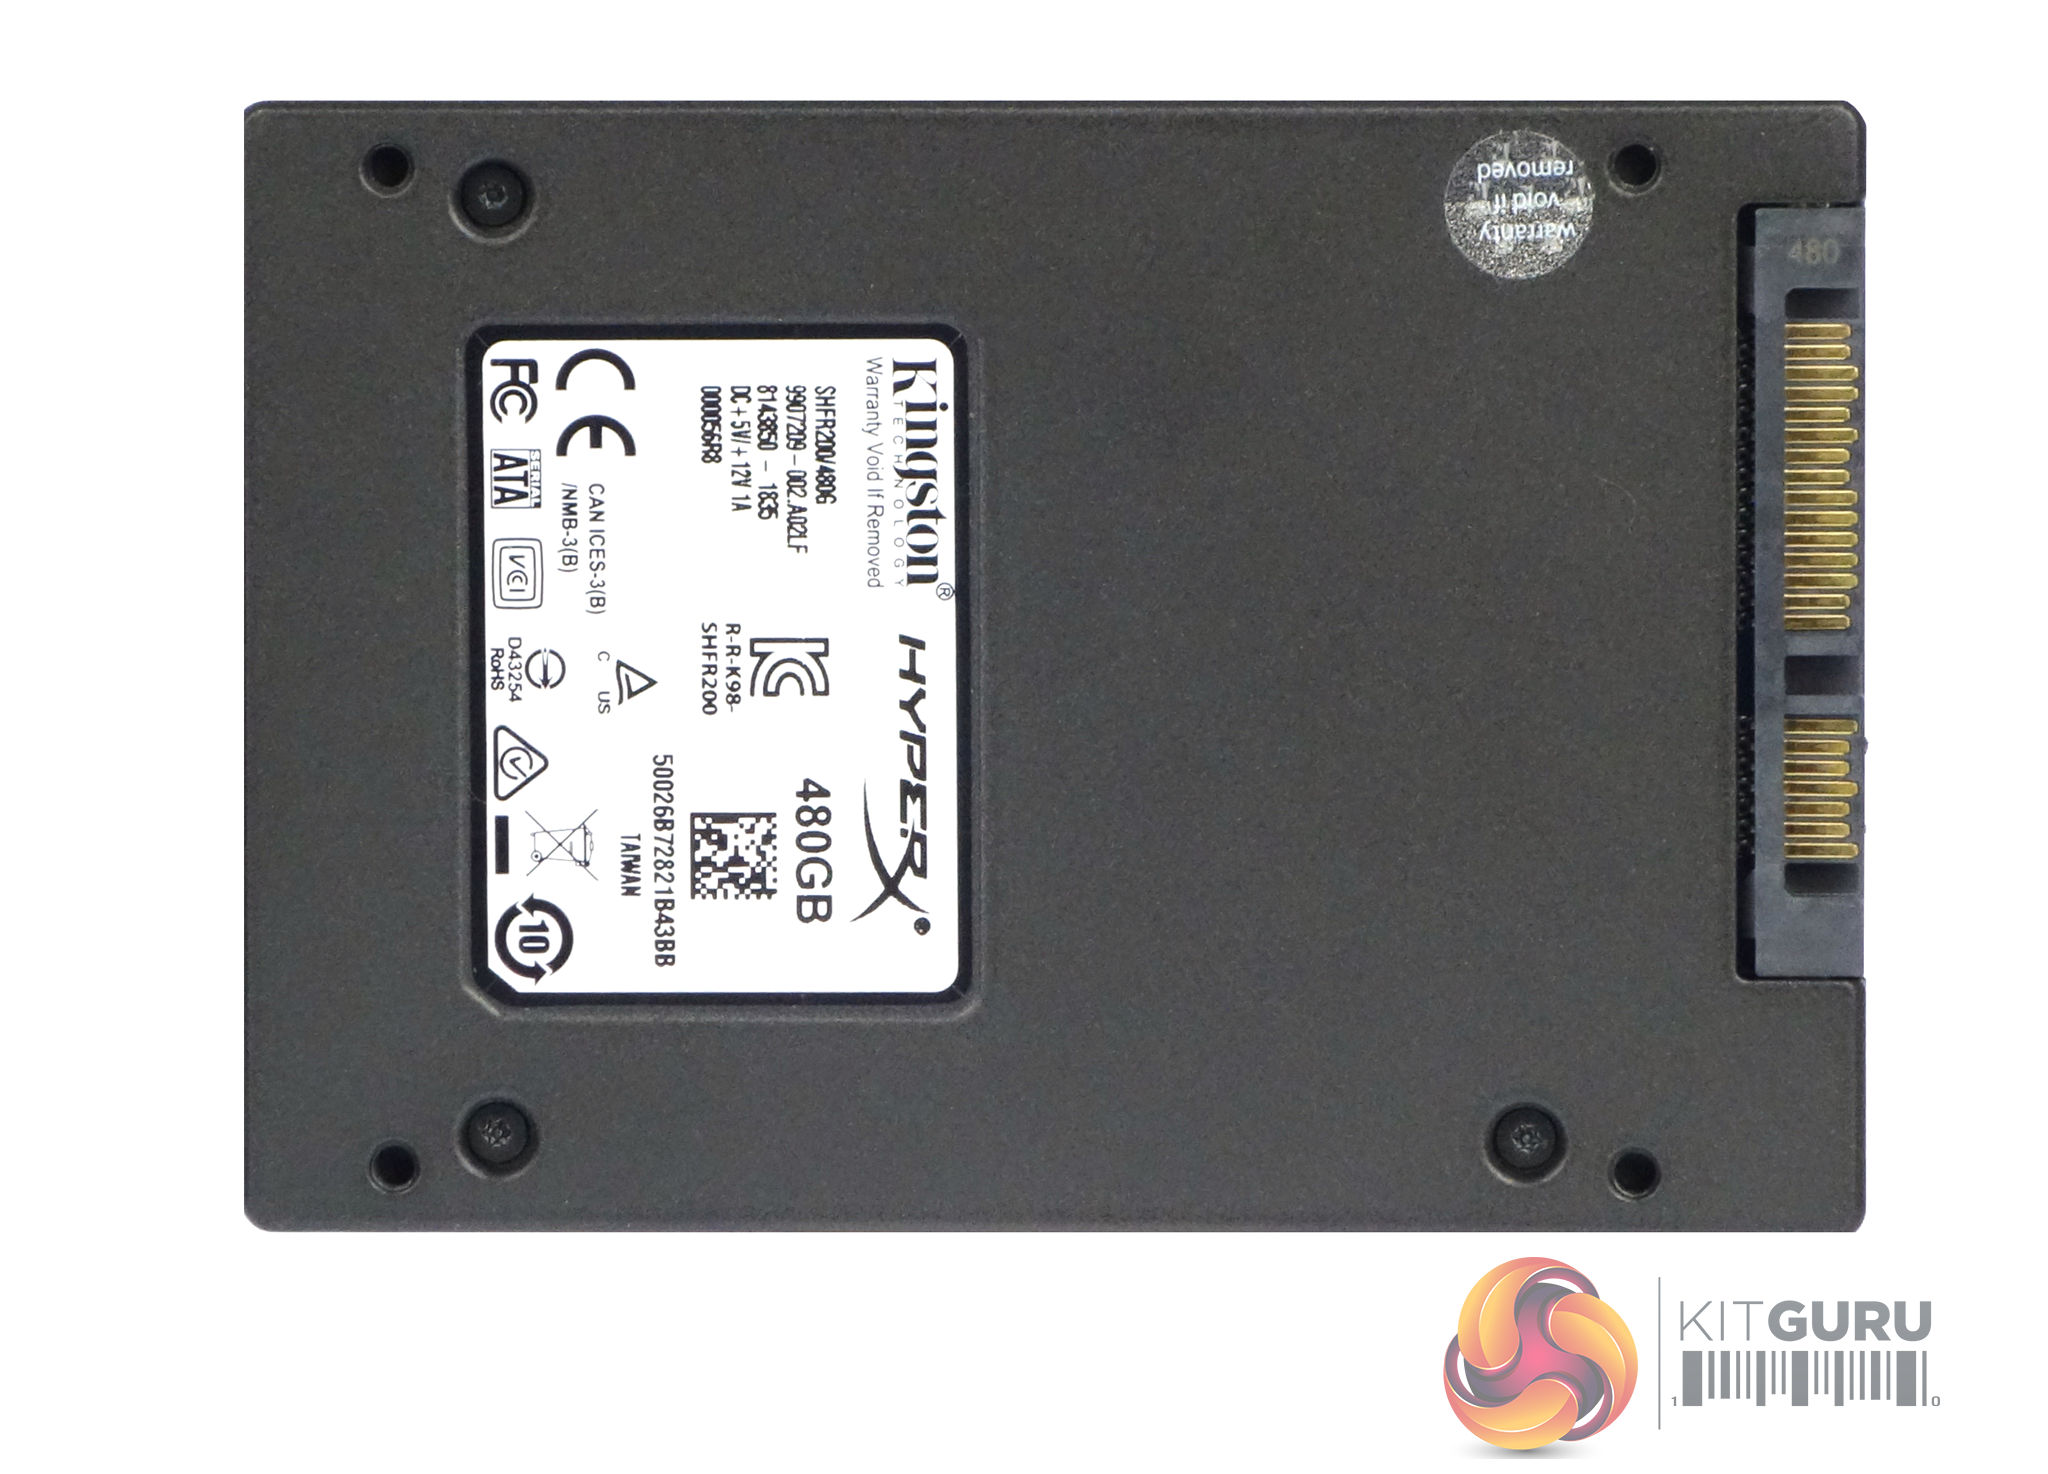
The HyperX Fury range is made up of three capacities; 240GB, 480GB and the flagship 960GB model. As with many Kingston consumer drives, the HyperX Fury RGB is available as a basic drive or part of an installation kit and it was the 480GB installation kit version (SHFR200B/480G) that Kingston kindly provided for this review.
With the basic drive you just get an RGB cable and a voucher for hard drive cloning software. The installation kit version of the drive comes with an impressive box bundle; USB 3.0 enclosure, 3.5” bracket and mounting screws, RGB and SATA cables, USB 3.1 type A to mini-USB cable and the voucher for hard drive cloning software, oh and a screwdriver.
The 480GB drive has a TBW endurance rating of 480TB and Kingston back the drive with a 3-year warranty.
Physical Specifications:
Usable Capacities: 480GB
NAND Components: 64-layer 3D TLC NAND
NAND Controller: Marvell 88SS1074
Interface: Serial ATA (SATA) 6Gb/s (SATA III)
Form Factor: 2.5in 9.5mm
Dimensions: 100.14 x 69.85 x 9.5
Drive Weight: 165g
Firmware Version: 000056R8
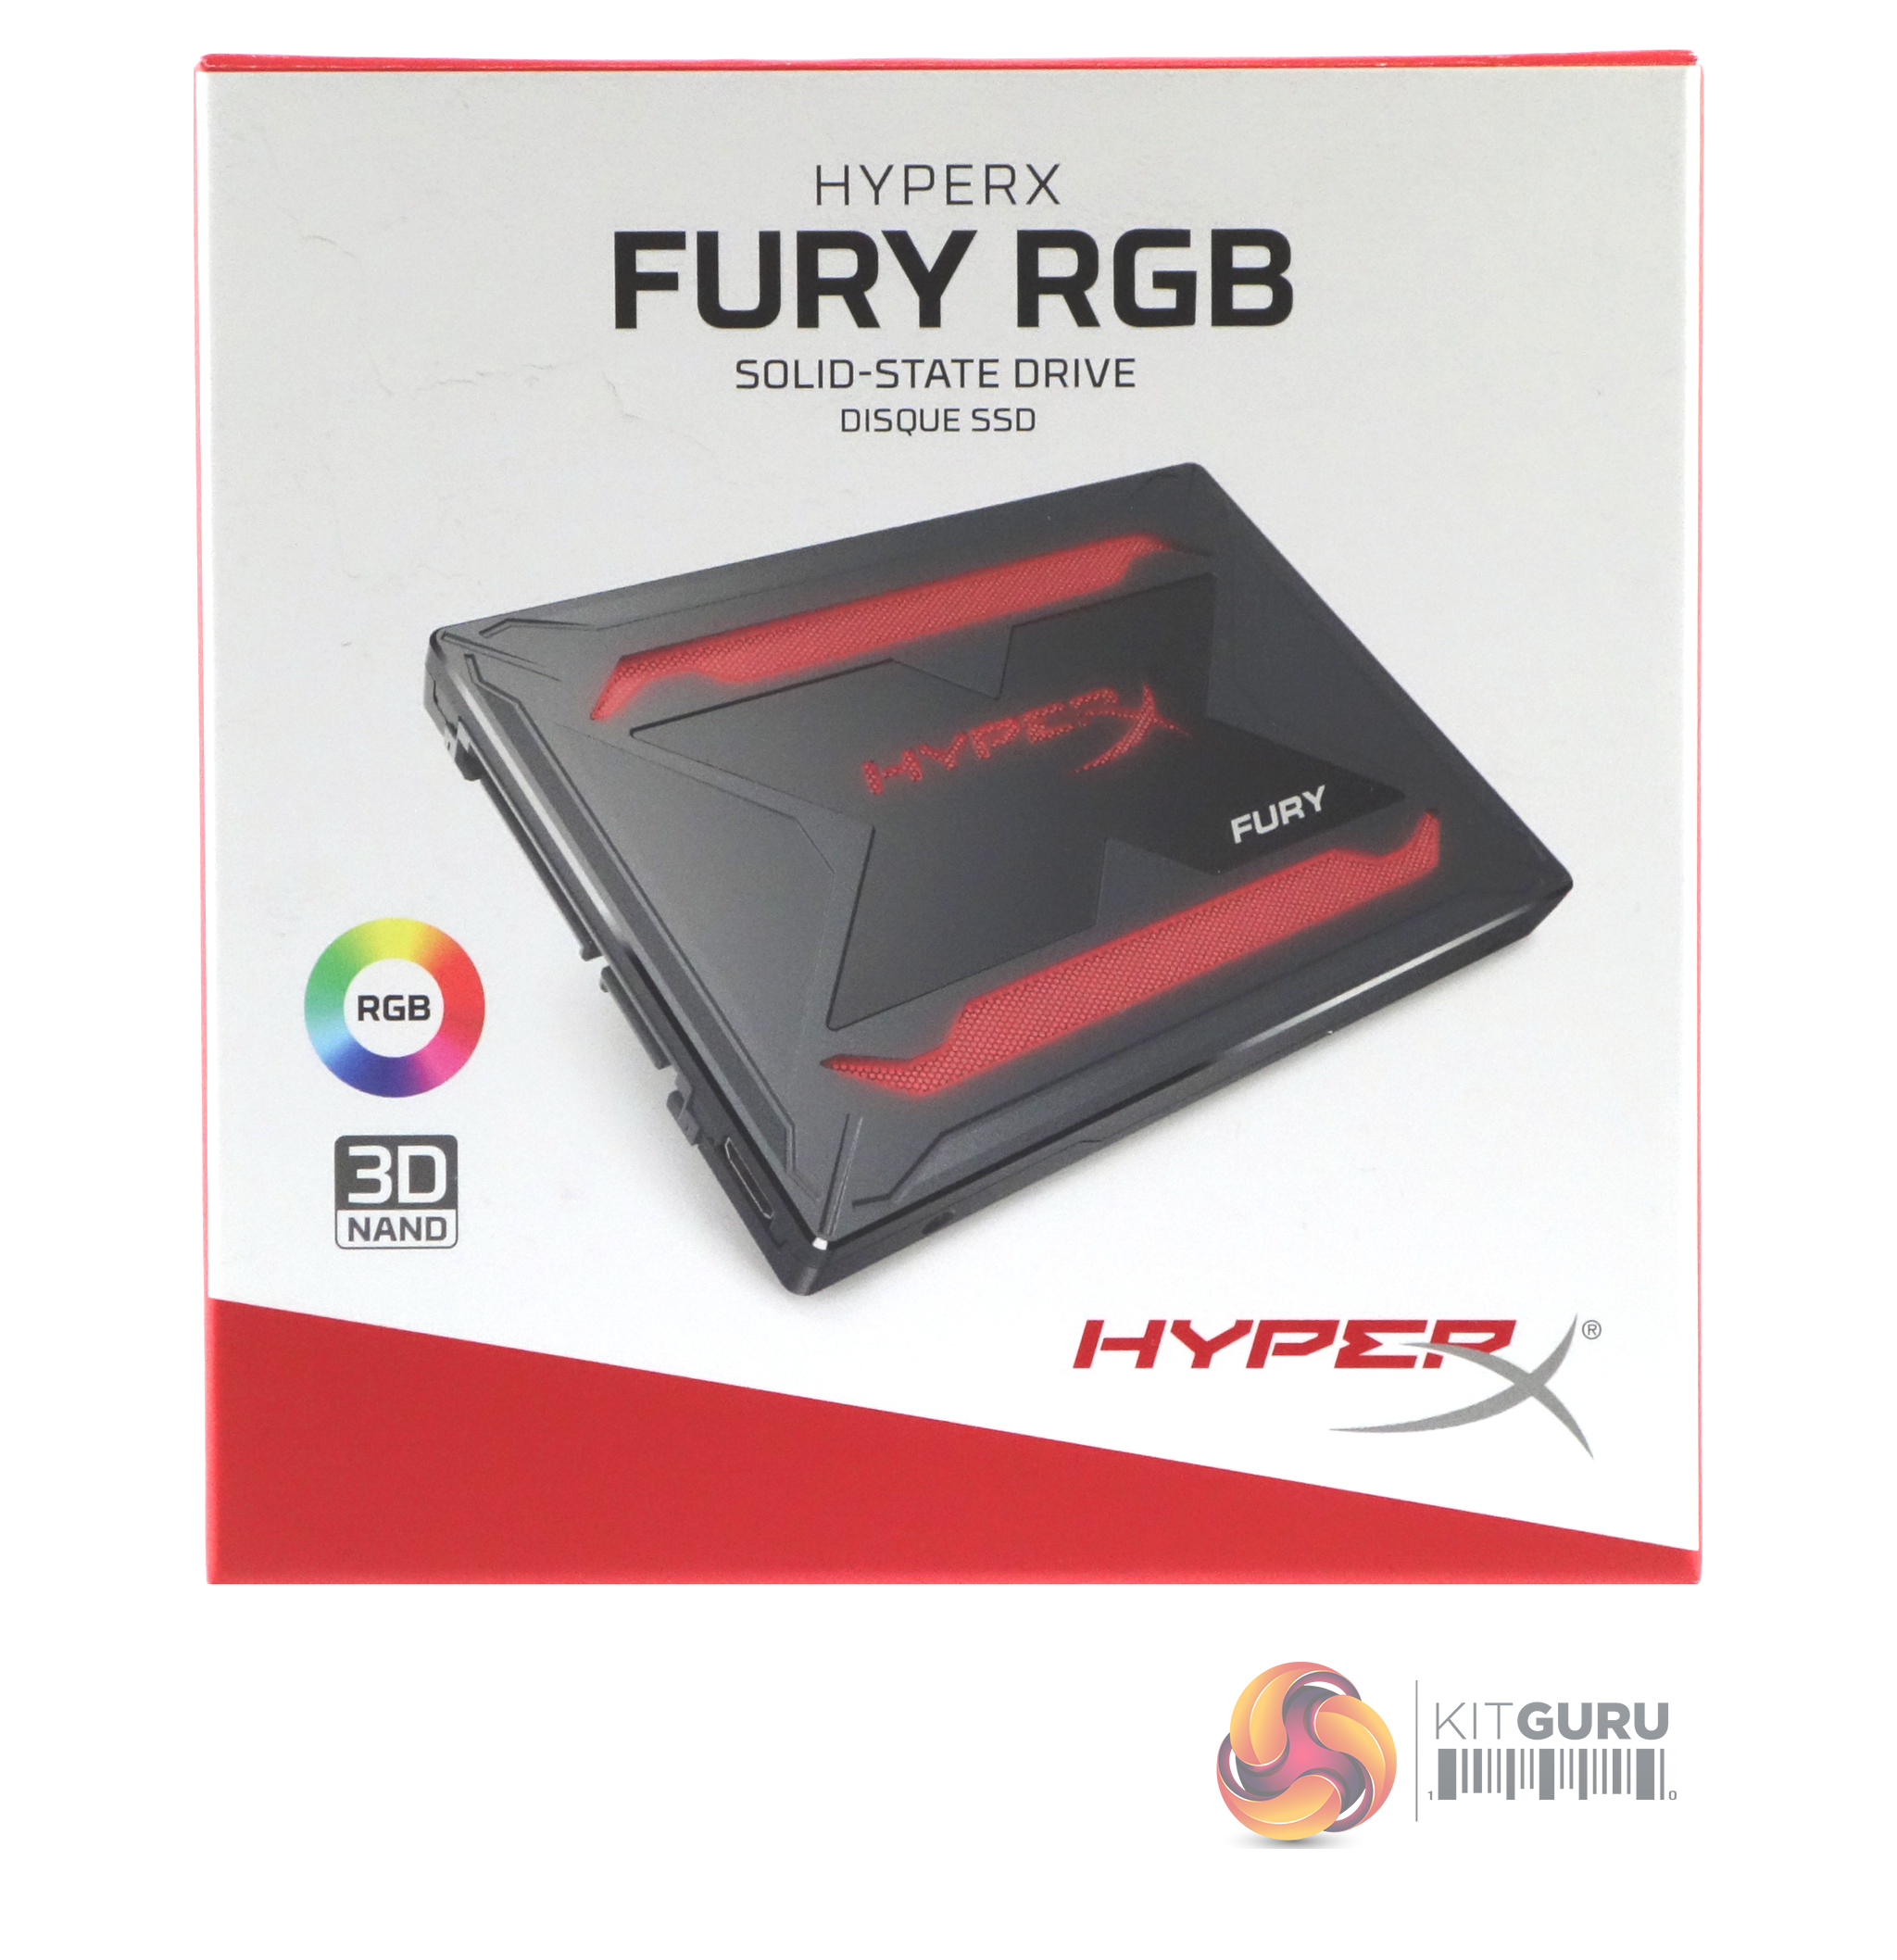
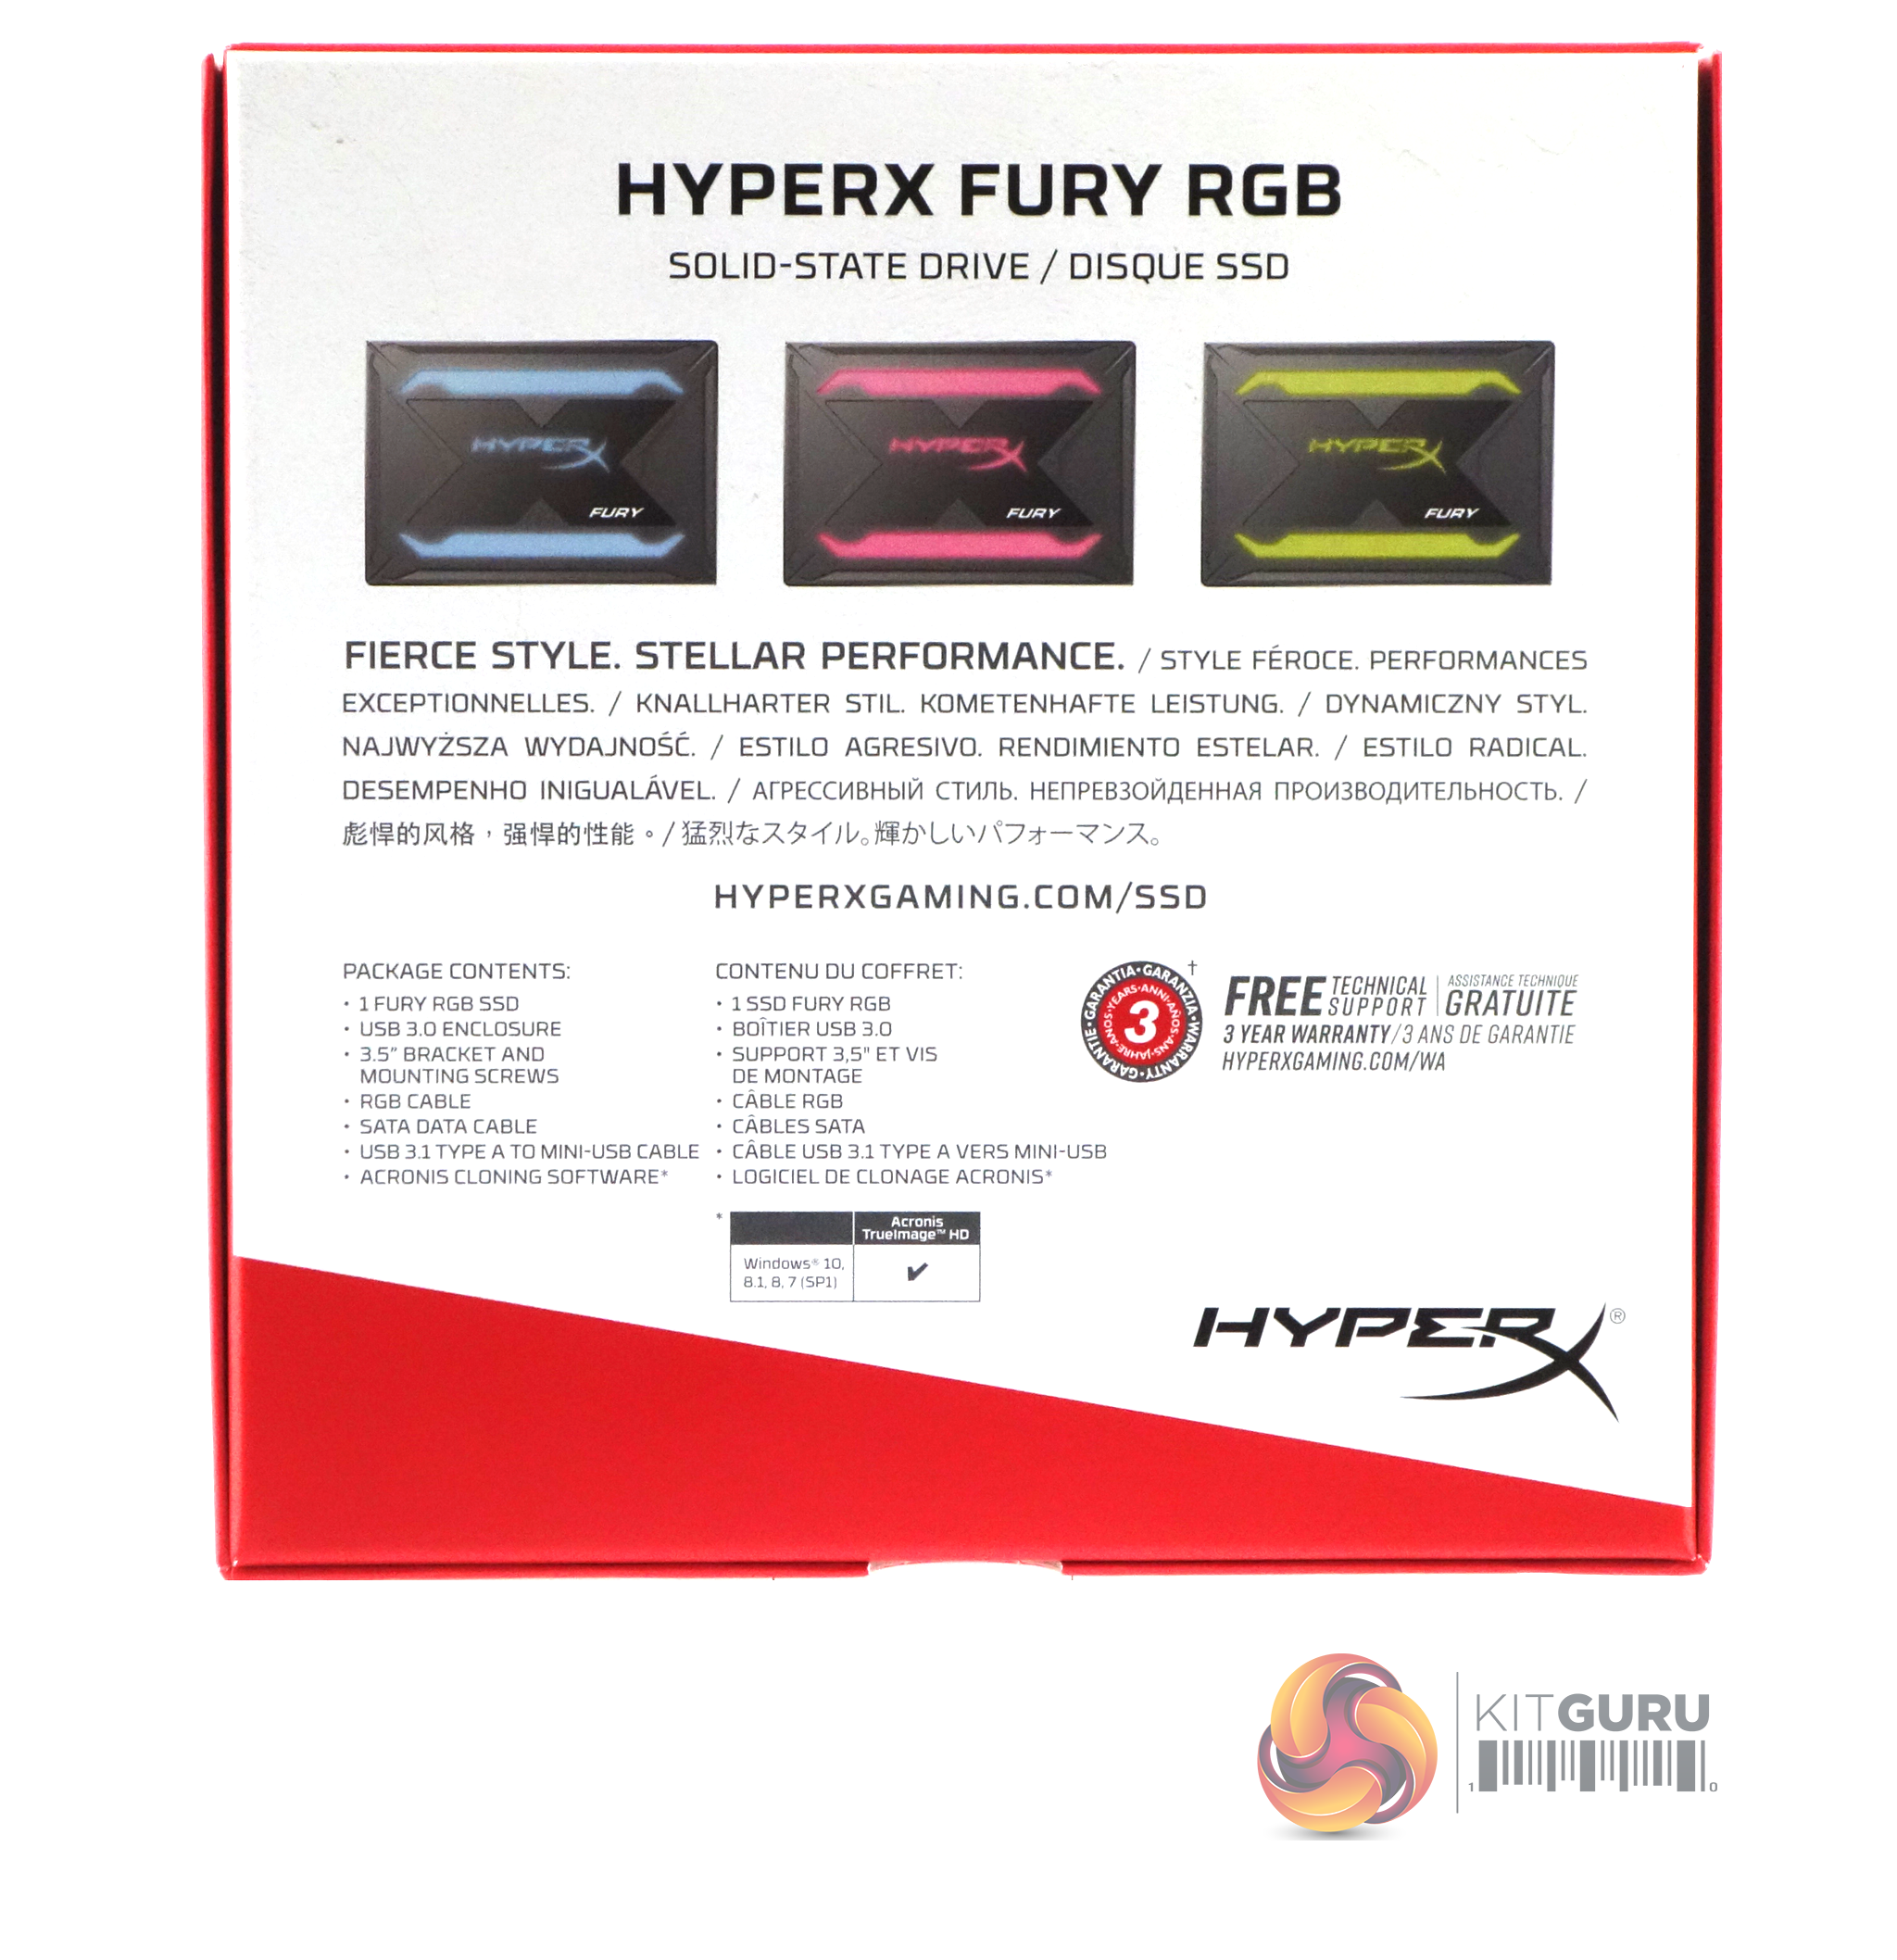
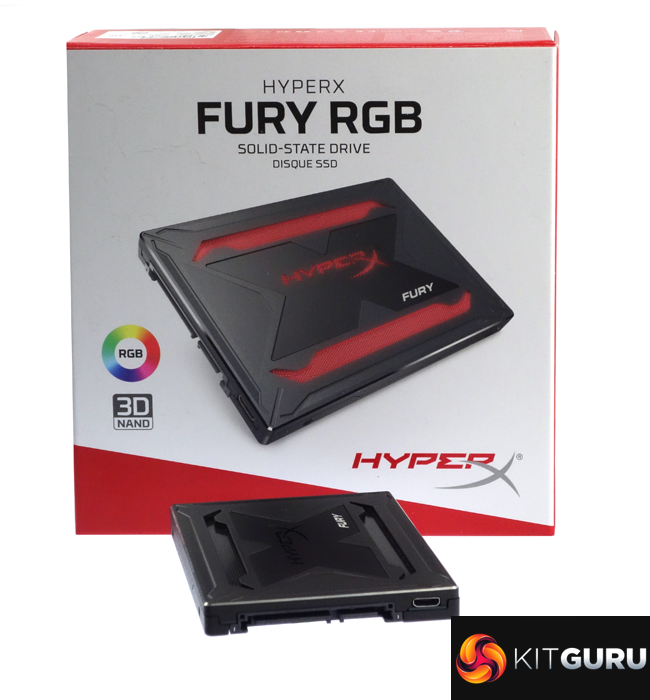
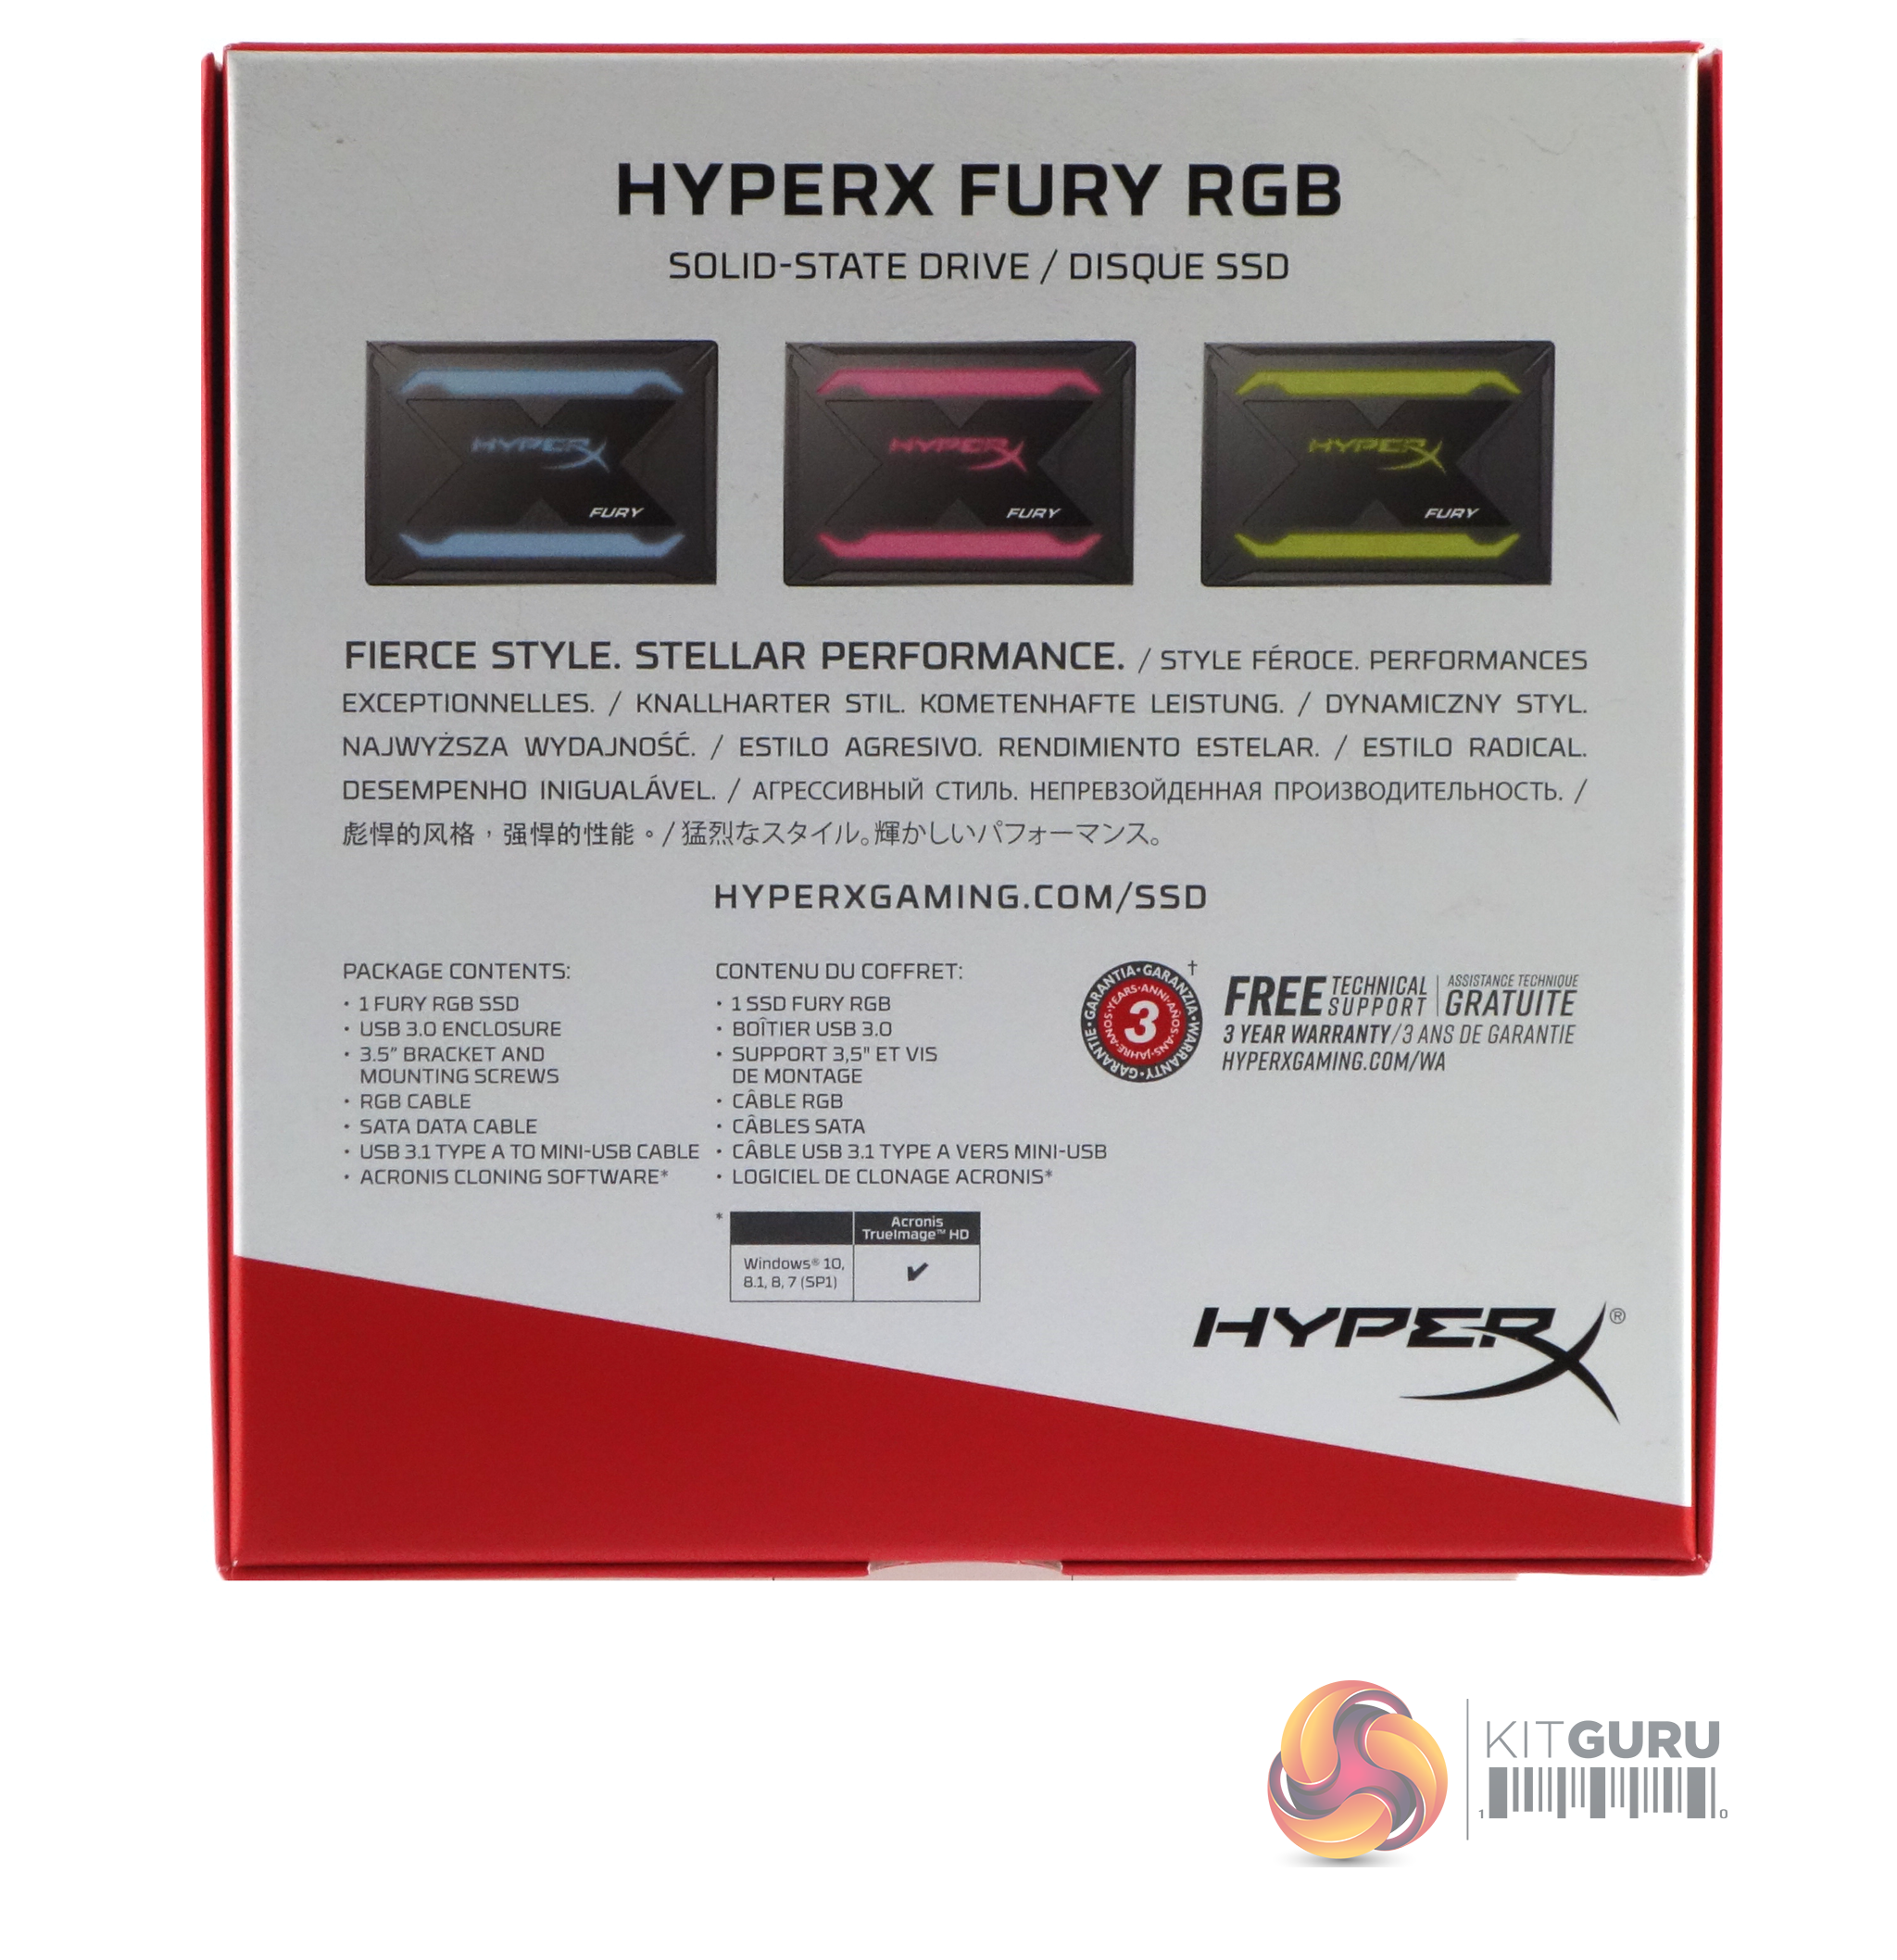
The front of the box has a large image of the drive together with a couple of icons displaying that the drive uses 3D NAND and it has RGB. The rear of the box has a trio of images showing three of the colours displayed as part of the RGB cycle.
Under these sit a box contents list in both English and French. To the side of this is a note about the 3-year warranty Kingston back the drive with.
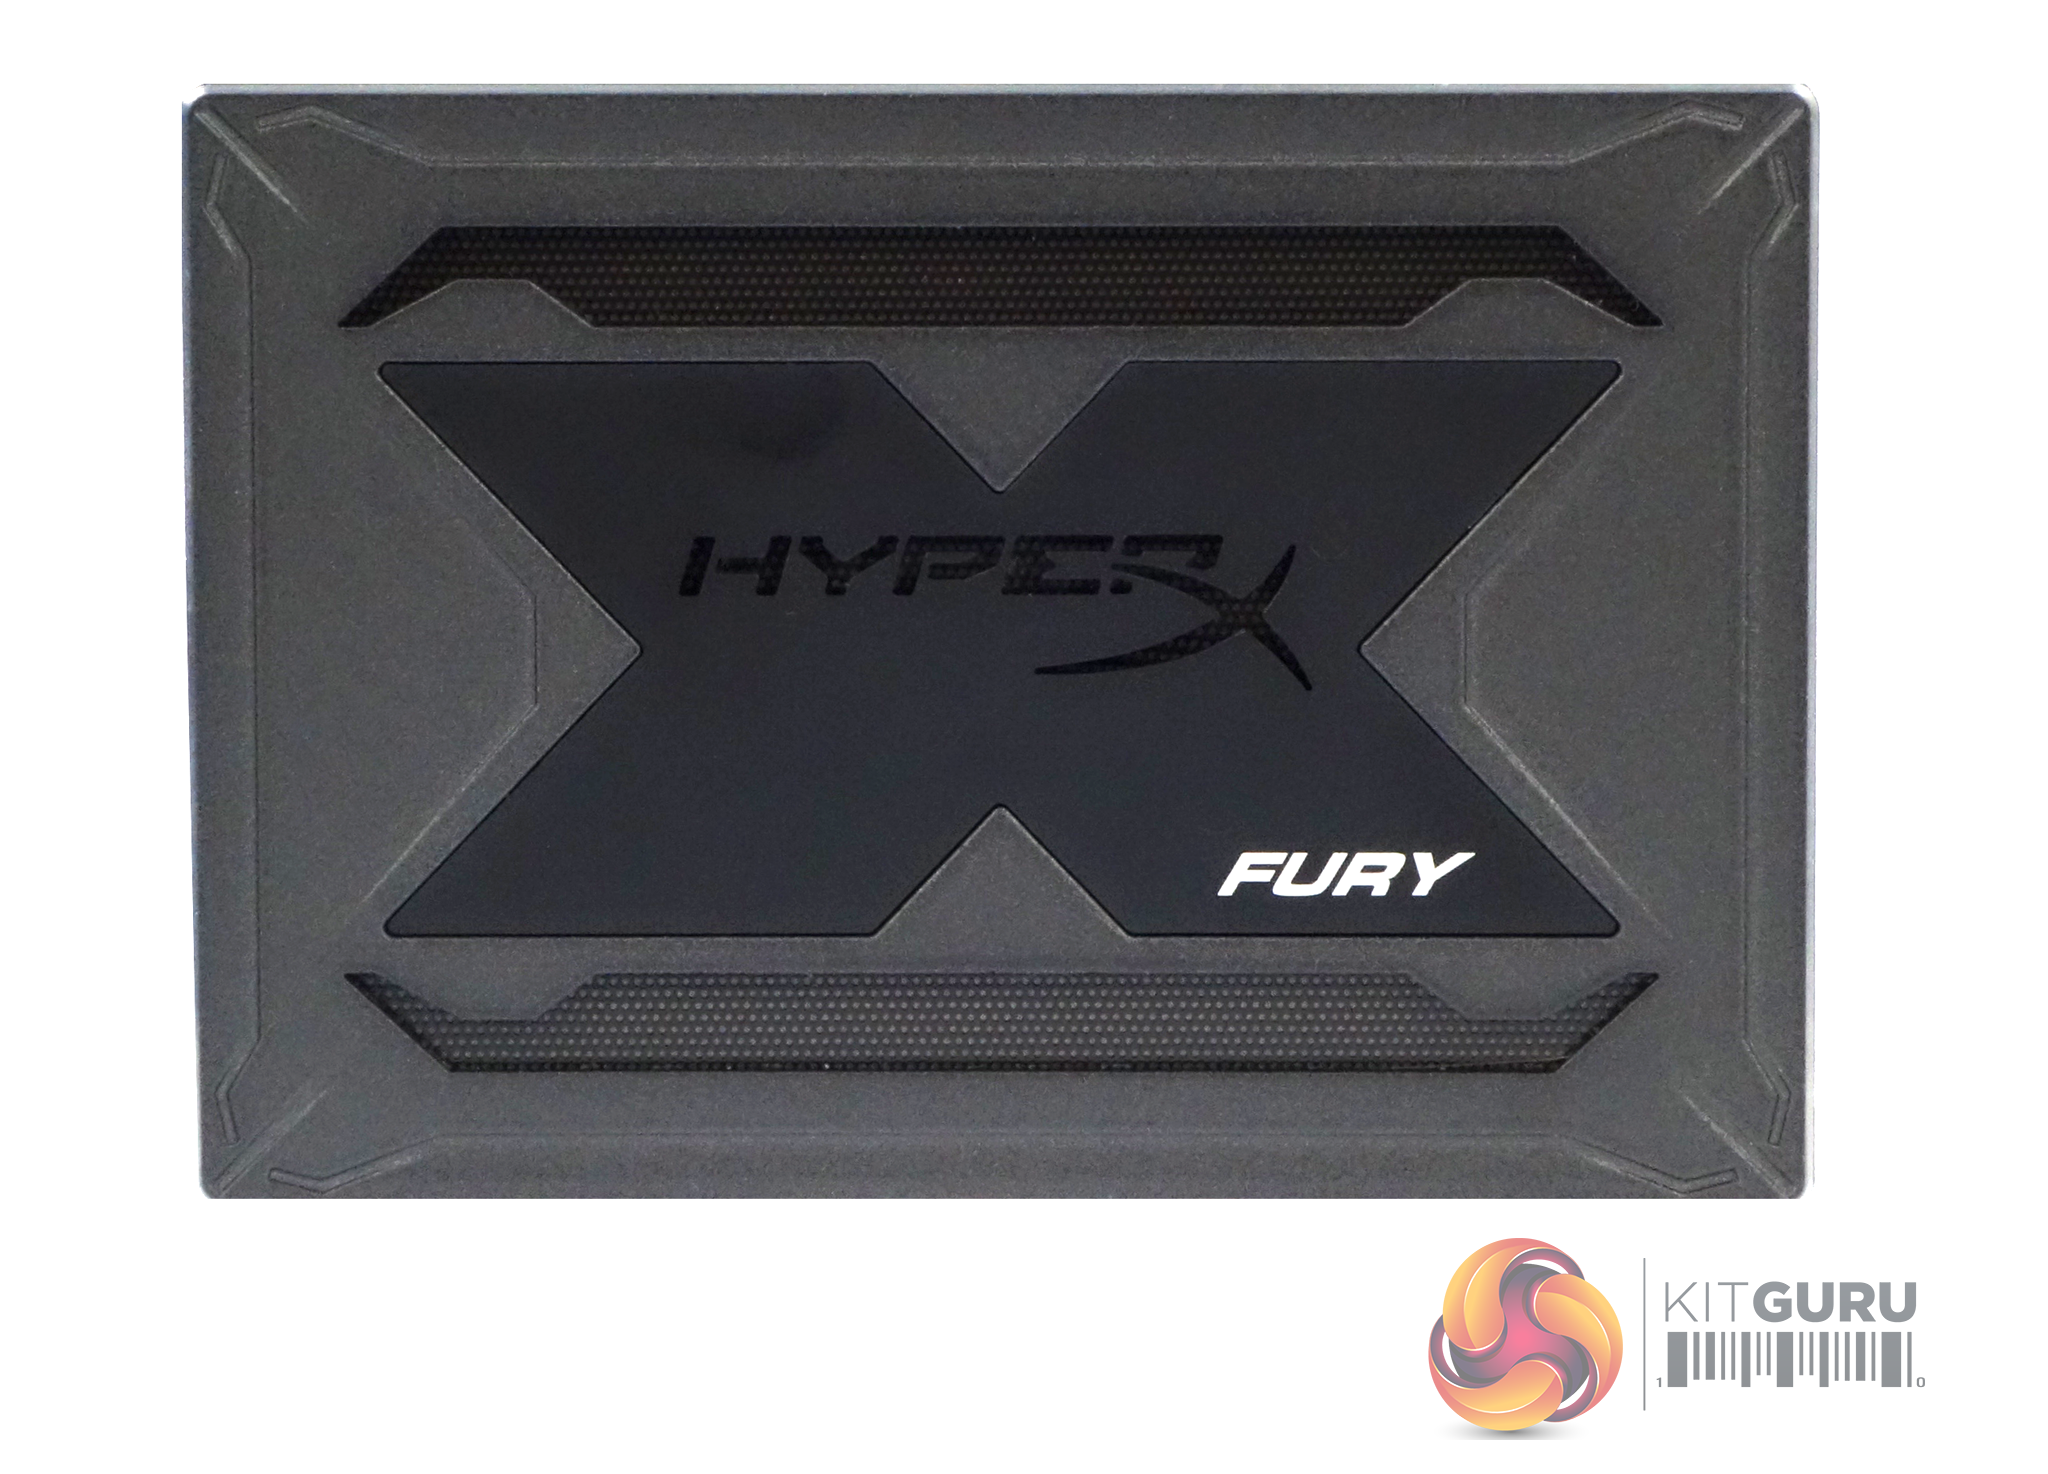
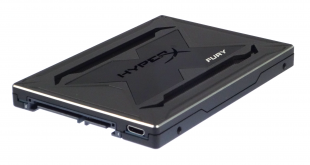
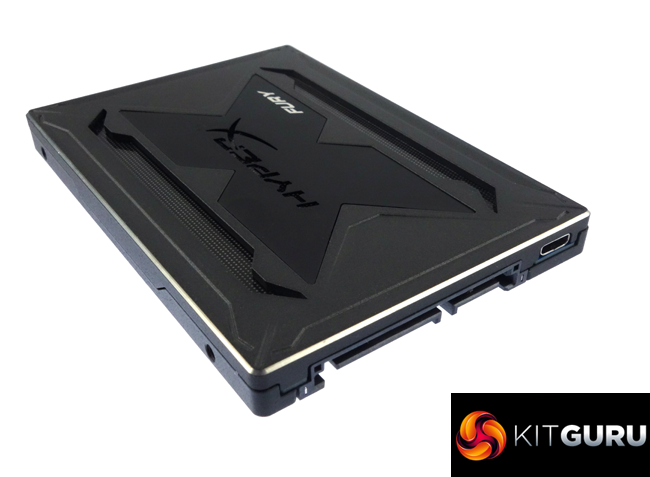
Thanks to its all metal case, the HyperX Fury RGB is one of the heaviest 2.5in drives we've seen or rather felt in a long while at 165 grms. The top of the drive has horizontal cut-outs at the top and bottom backed by a fine mesh that the LEDs shine through as does the HyperX brand lettering.
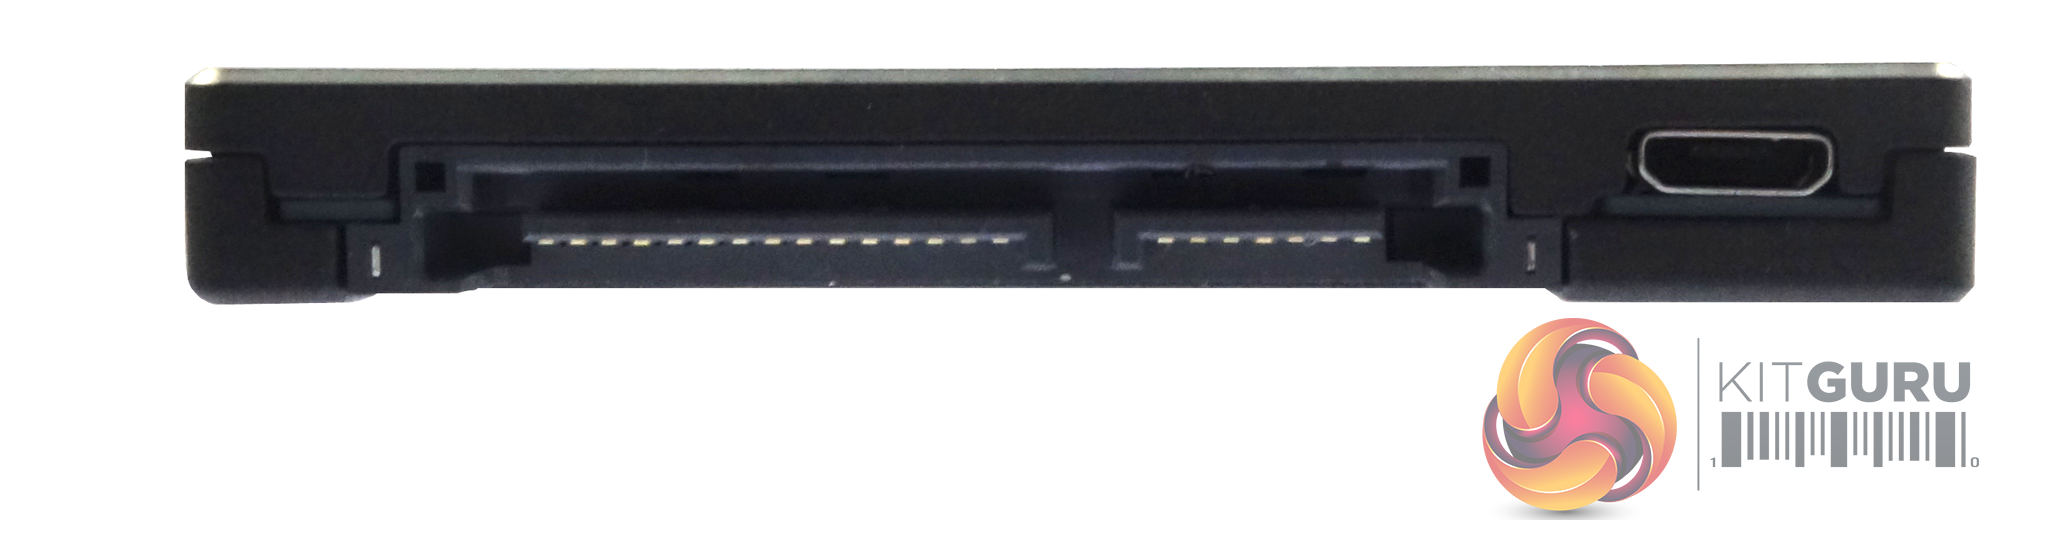
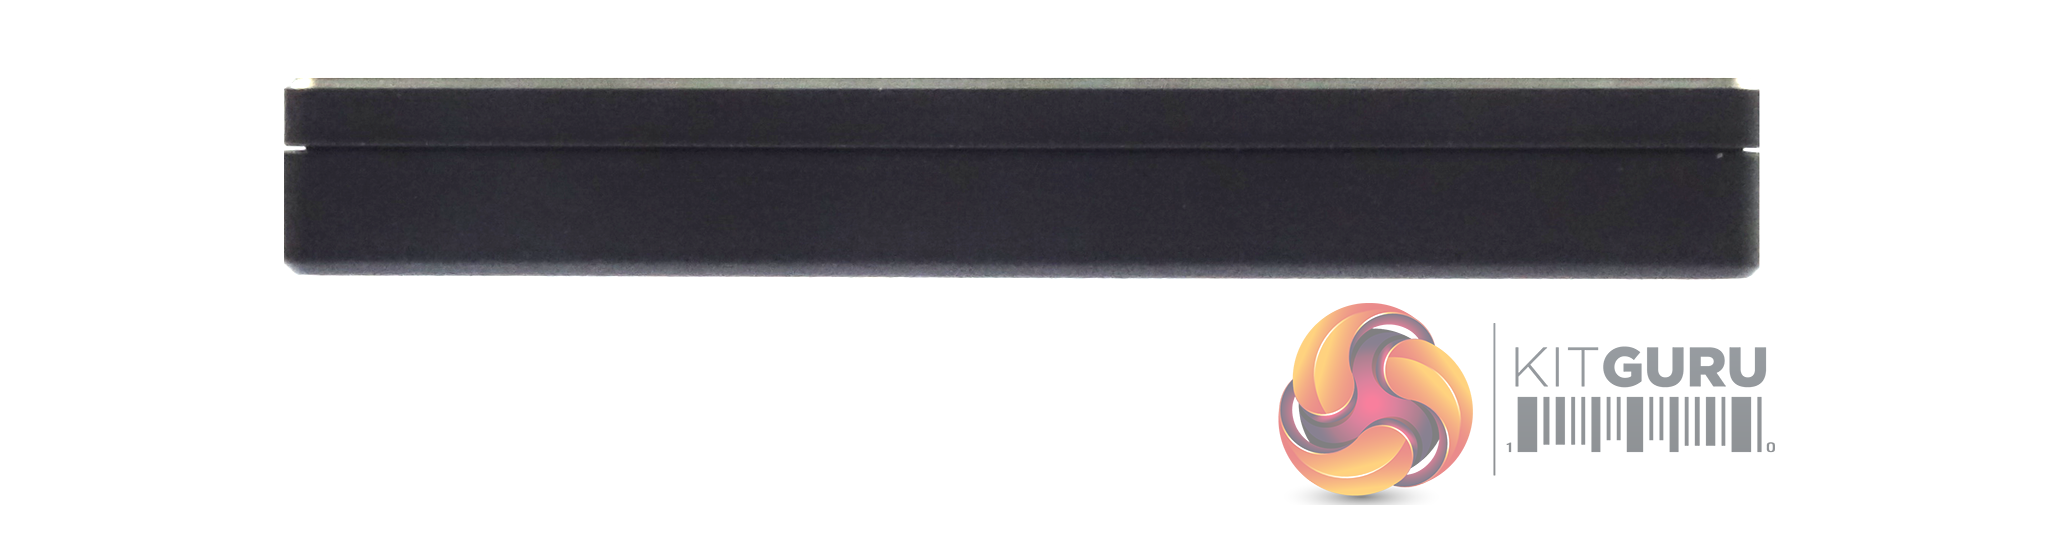
The HyperX Fury RGB is built on a standard 2.5in format but because of the RGB technology it's 9mm thick instead of the usual 7mm. The USB micro-B connector next to the SATA connectors is used as the connector for the RGB technology (it's not wired to be USB compatible). This port is connected to a 4-pin 12V RGB header on the motherboard or other lighting controller by use of the bundled cable.
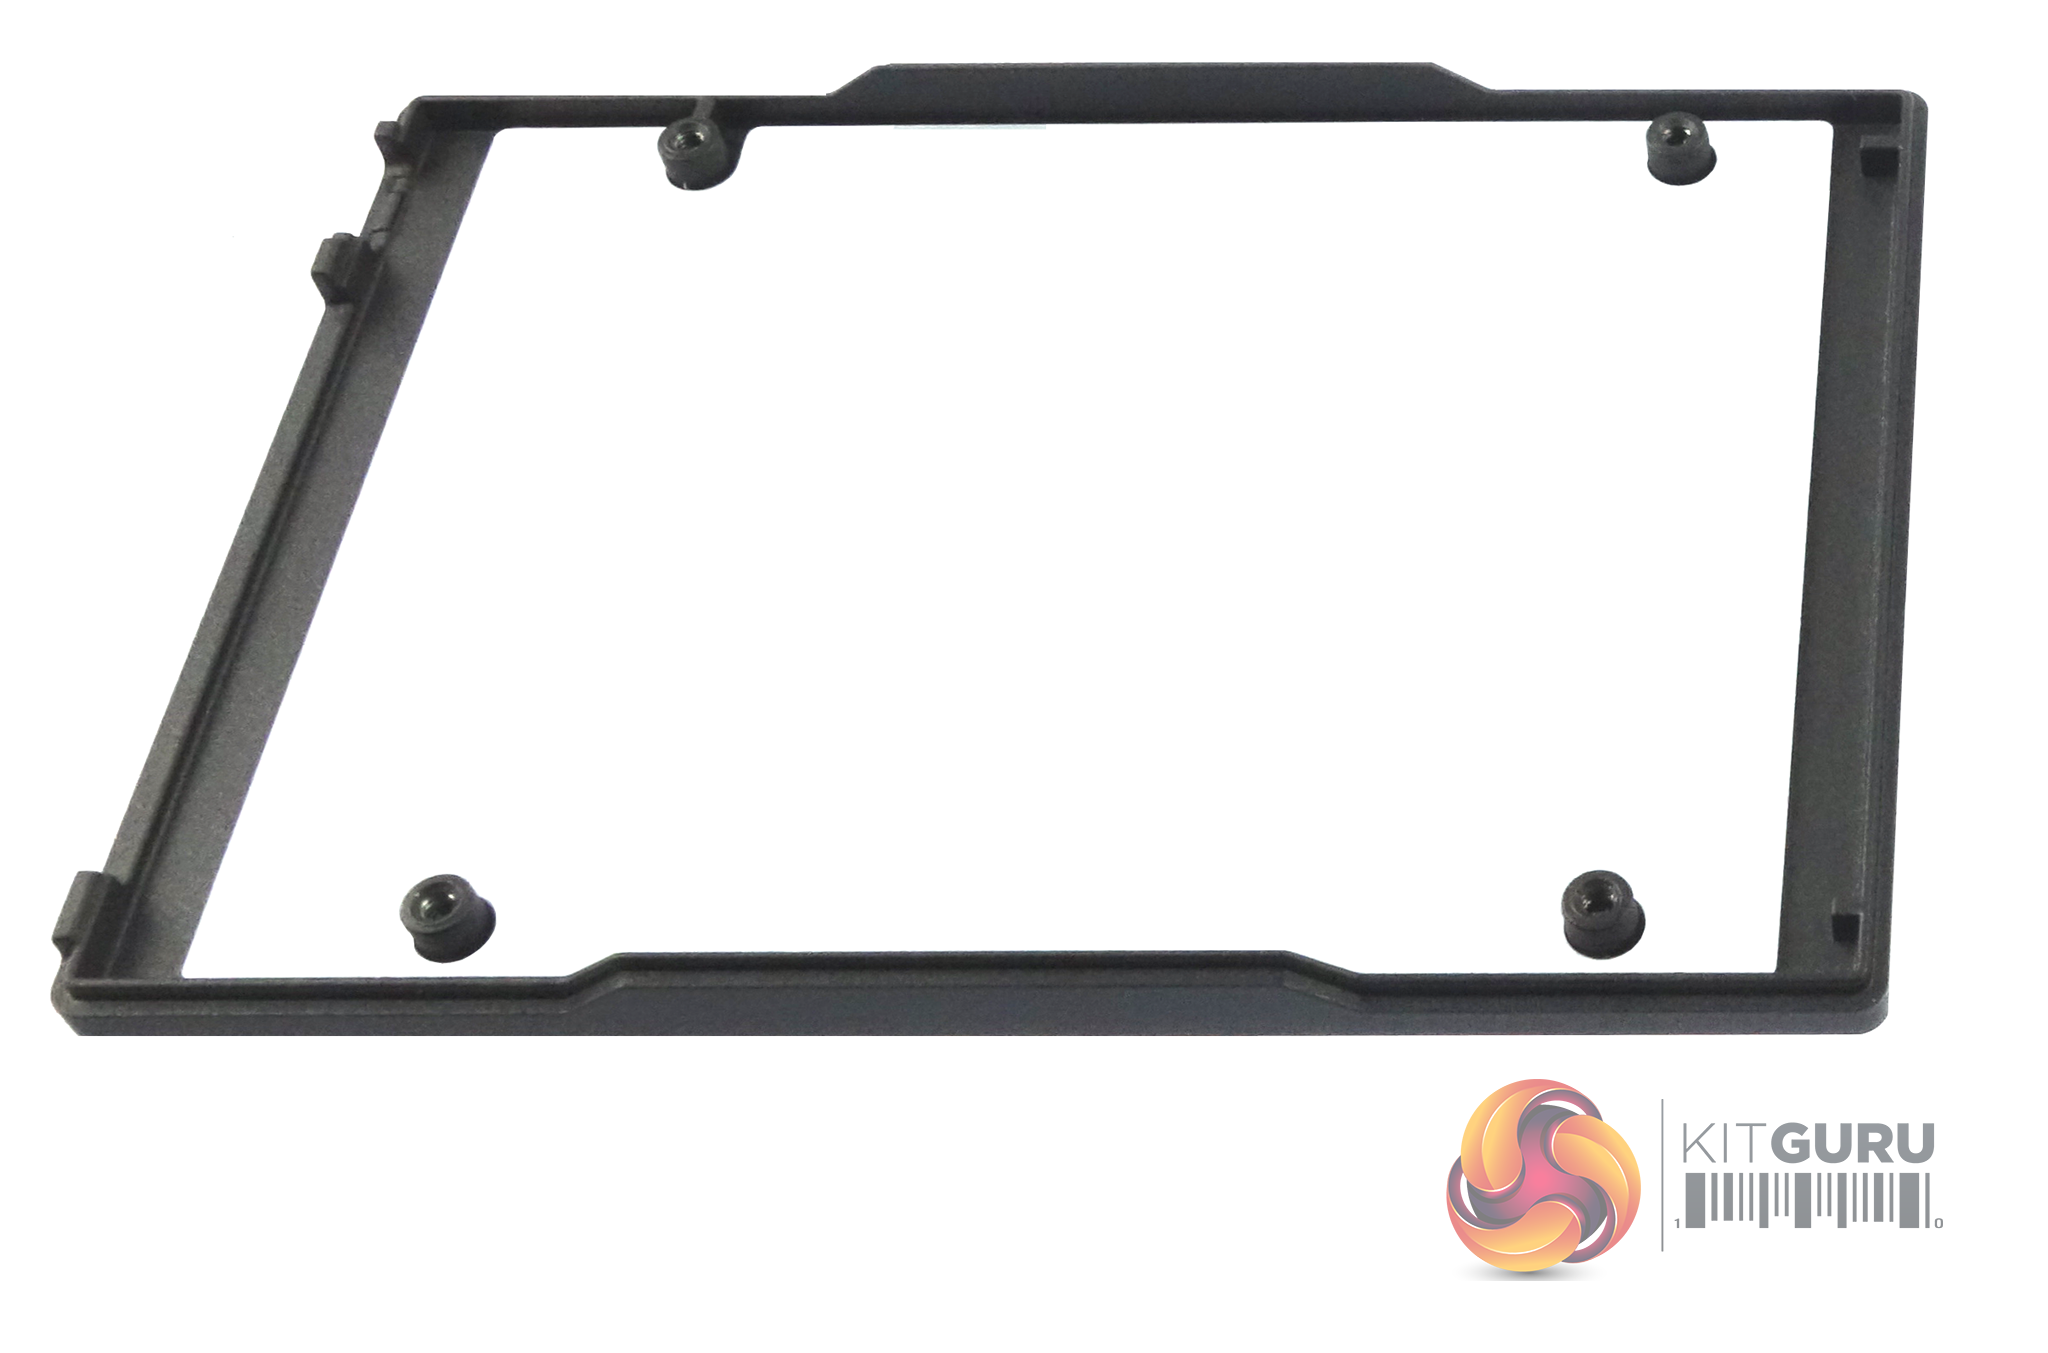
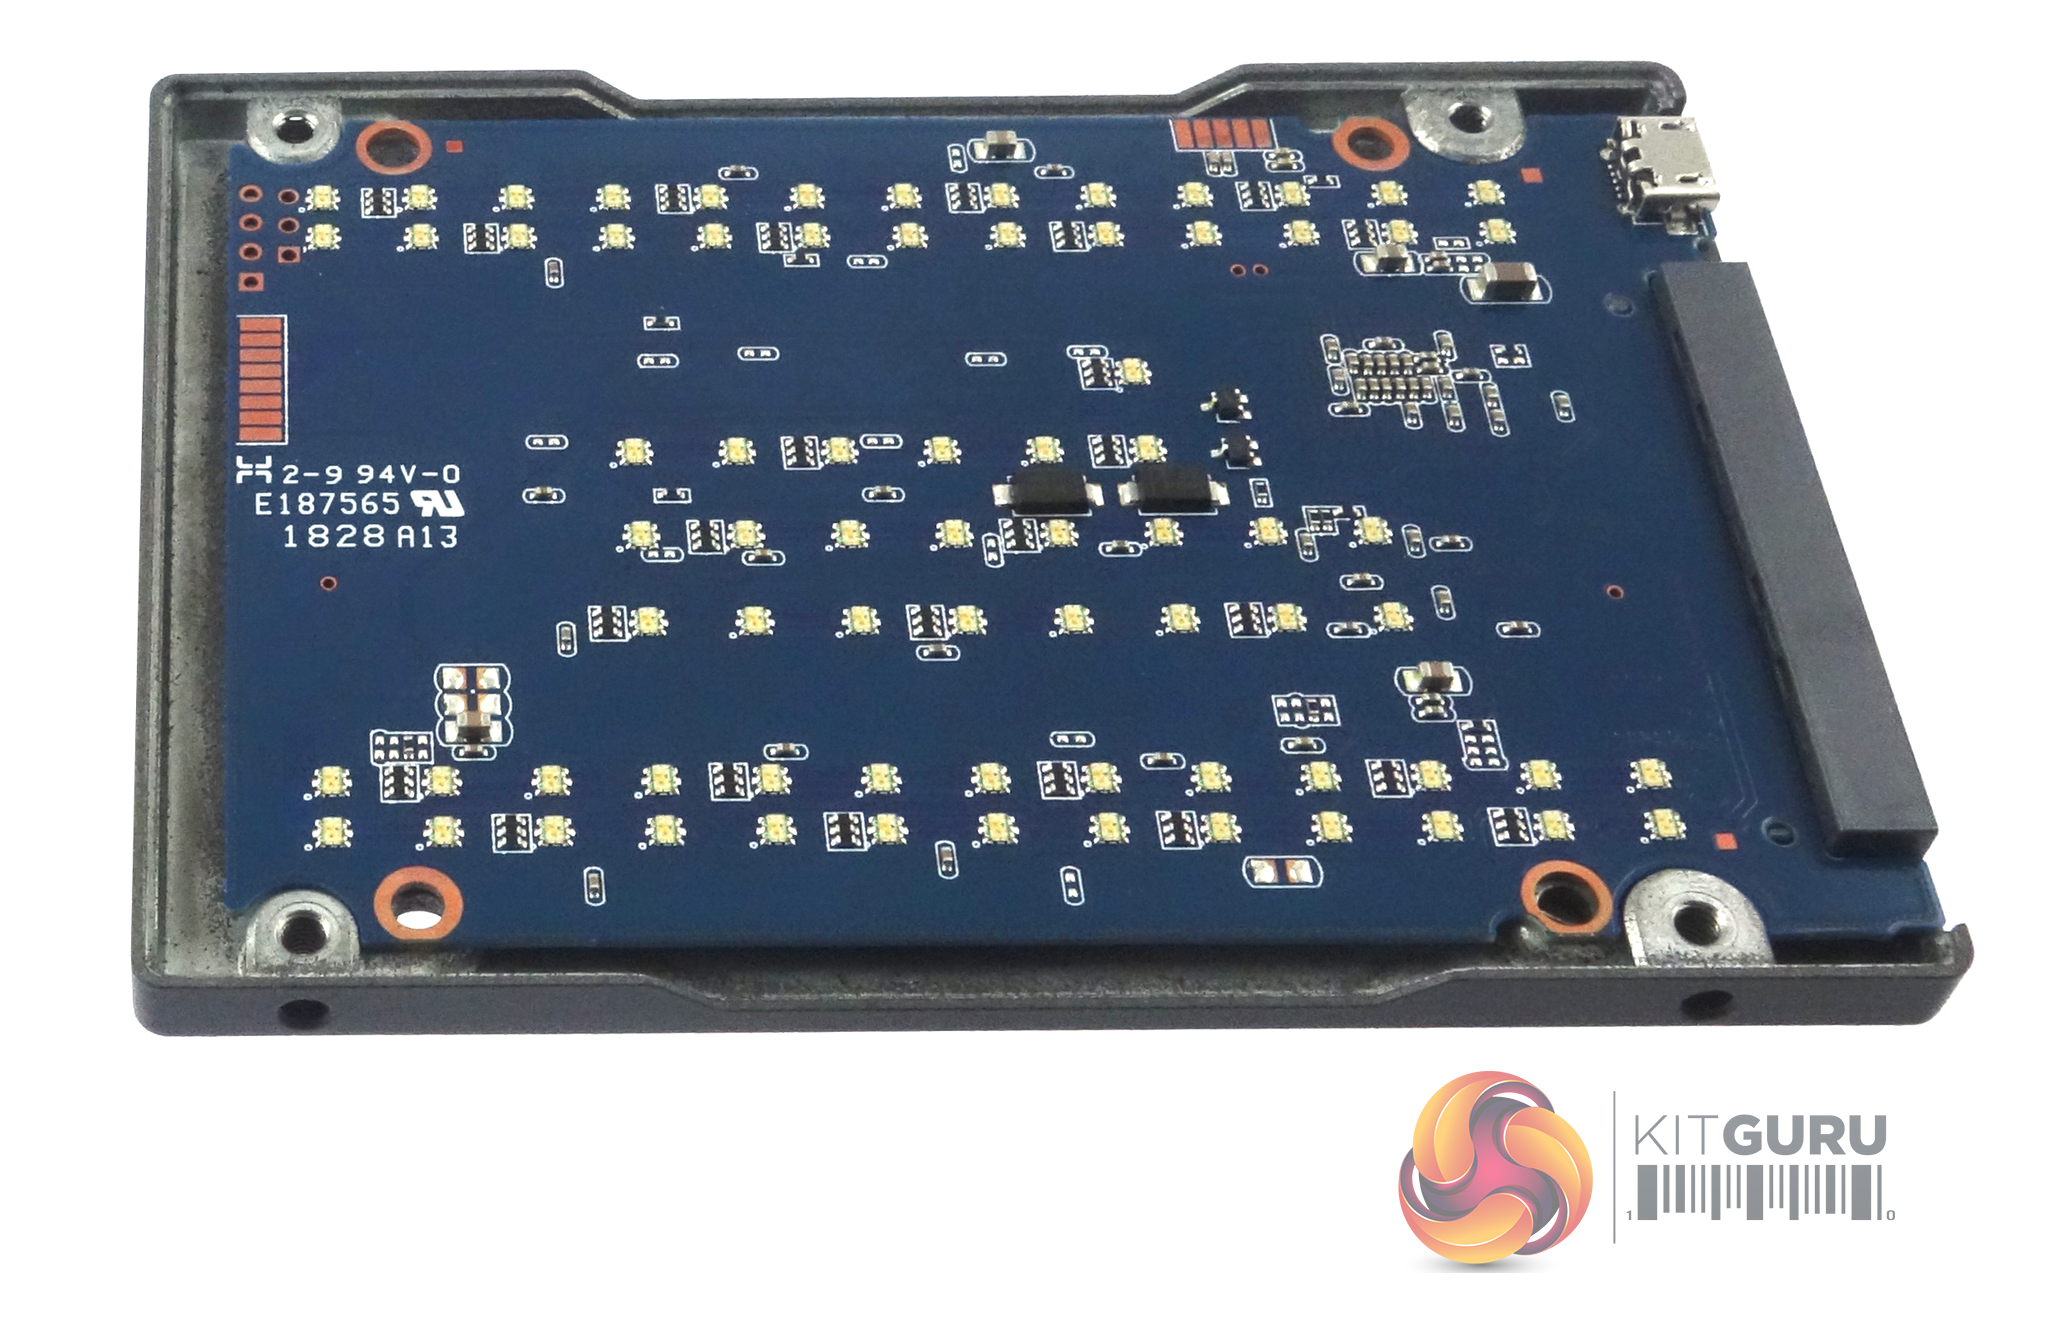
Taking the lid off the drive reveals a white plastic backing to the lid design where the cut outs for the RGB LED's shine through. Talking of LEDs, there are 75, yes 75 (we've counted them!!) on one side of the PCB.
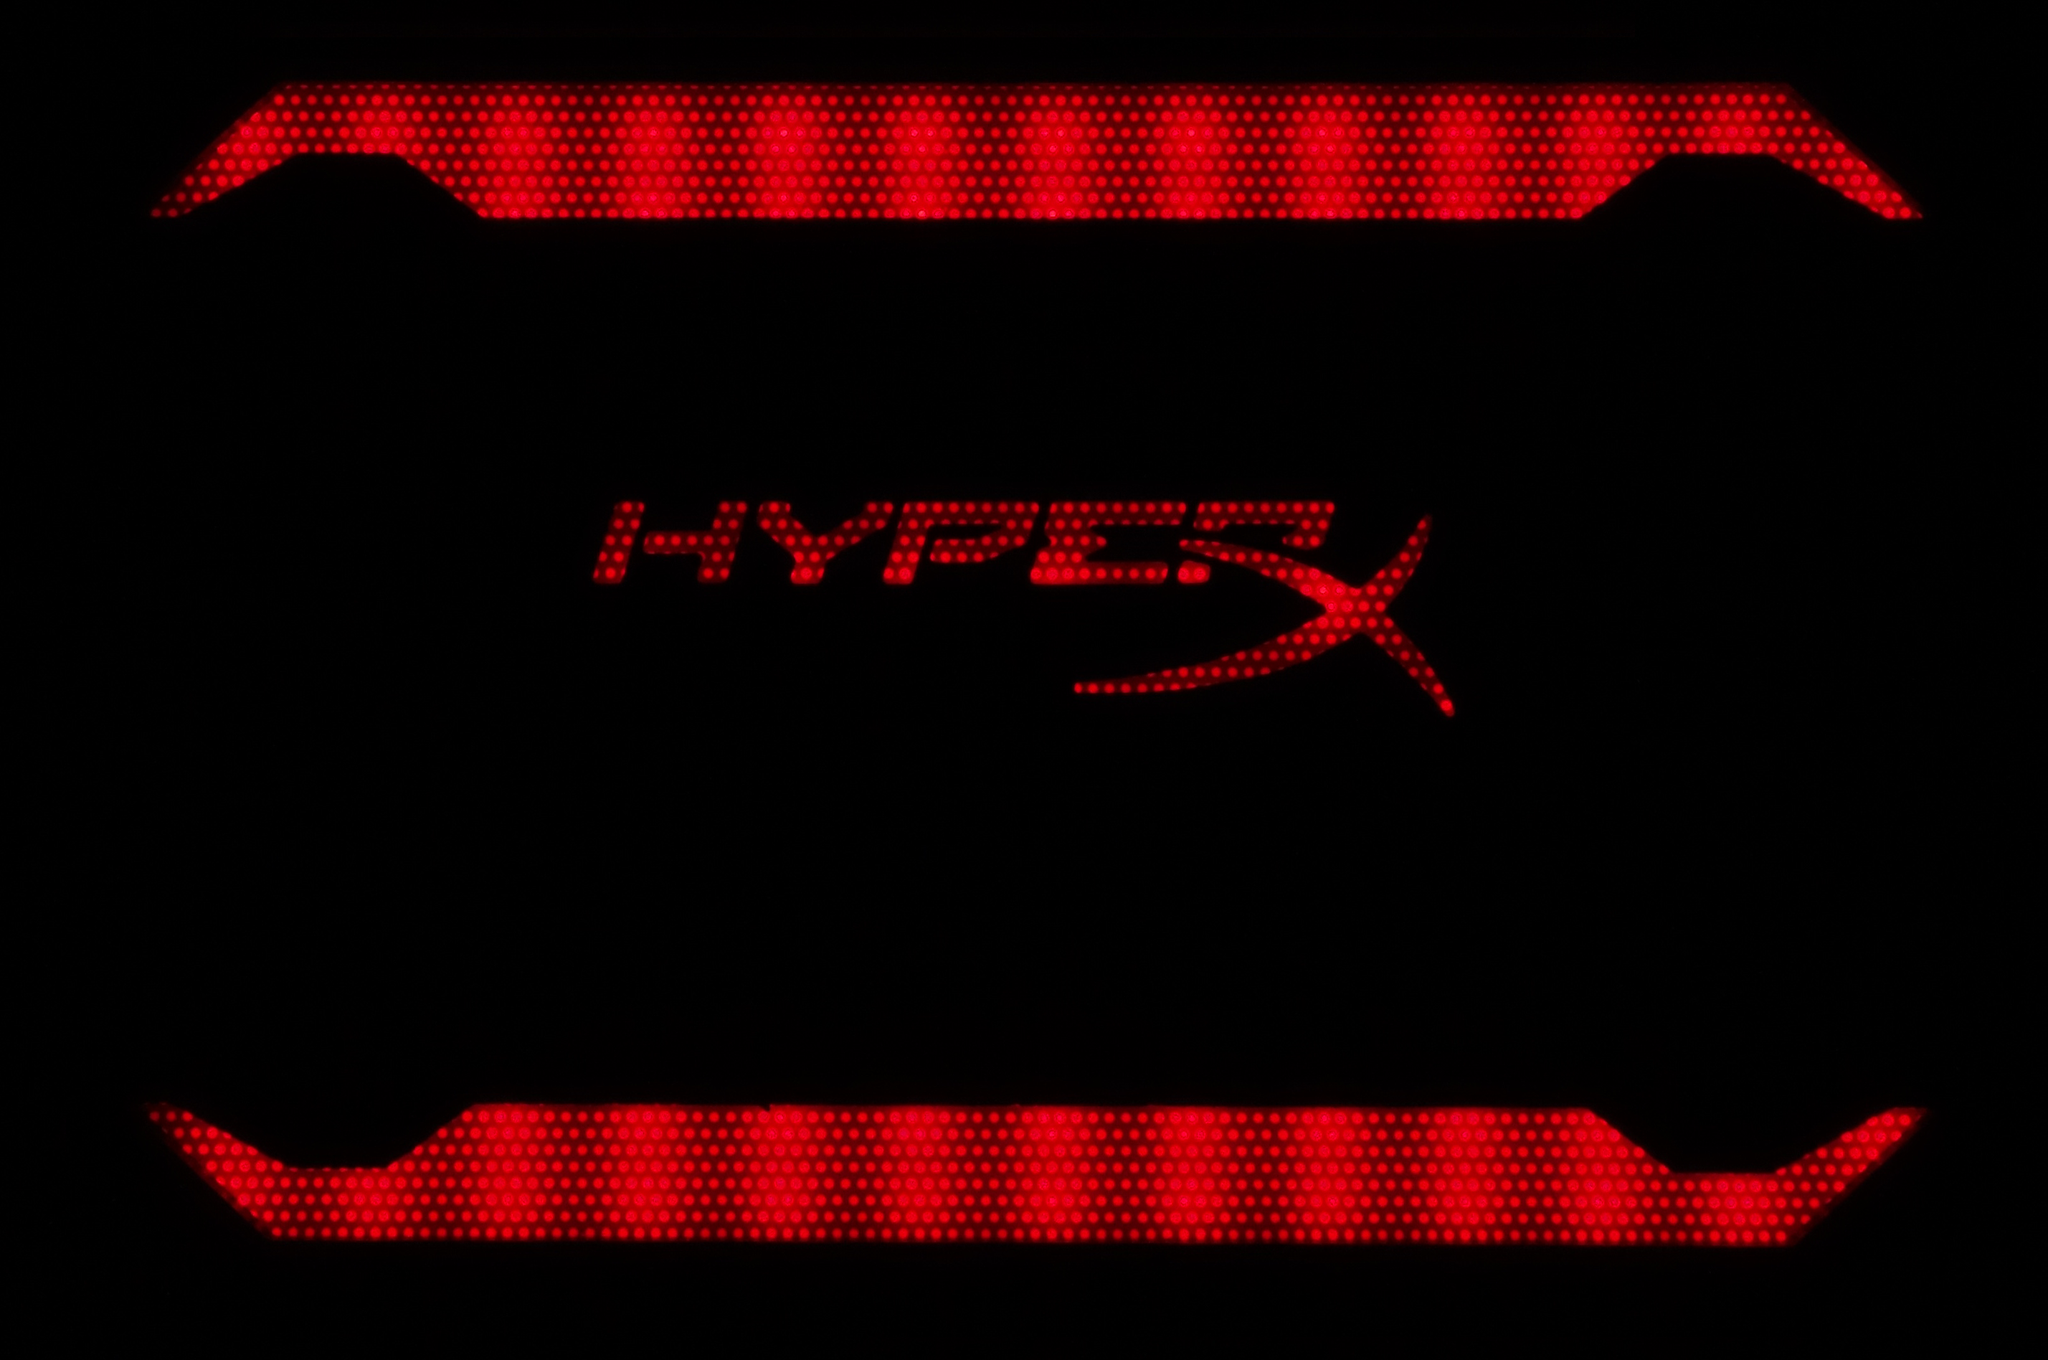
Without any RGB control, the drive defaults to a Red lighting scheme which gives the drive a bit of an edgy look when it's powered up.
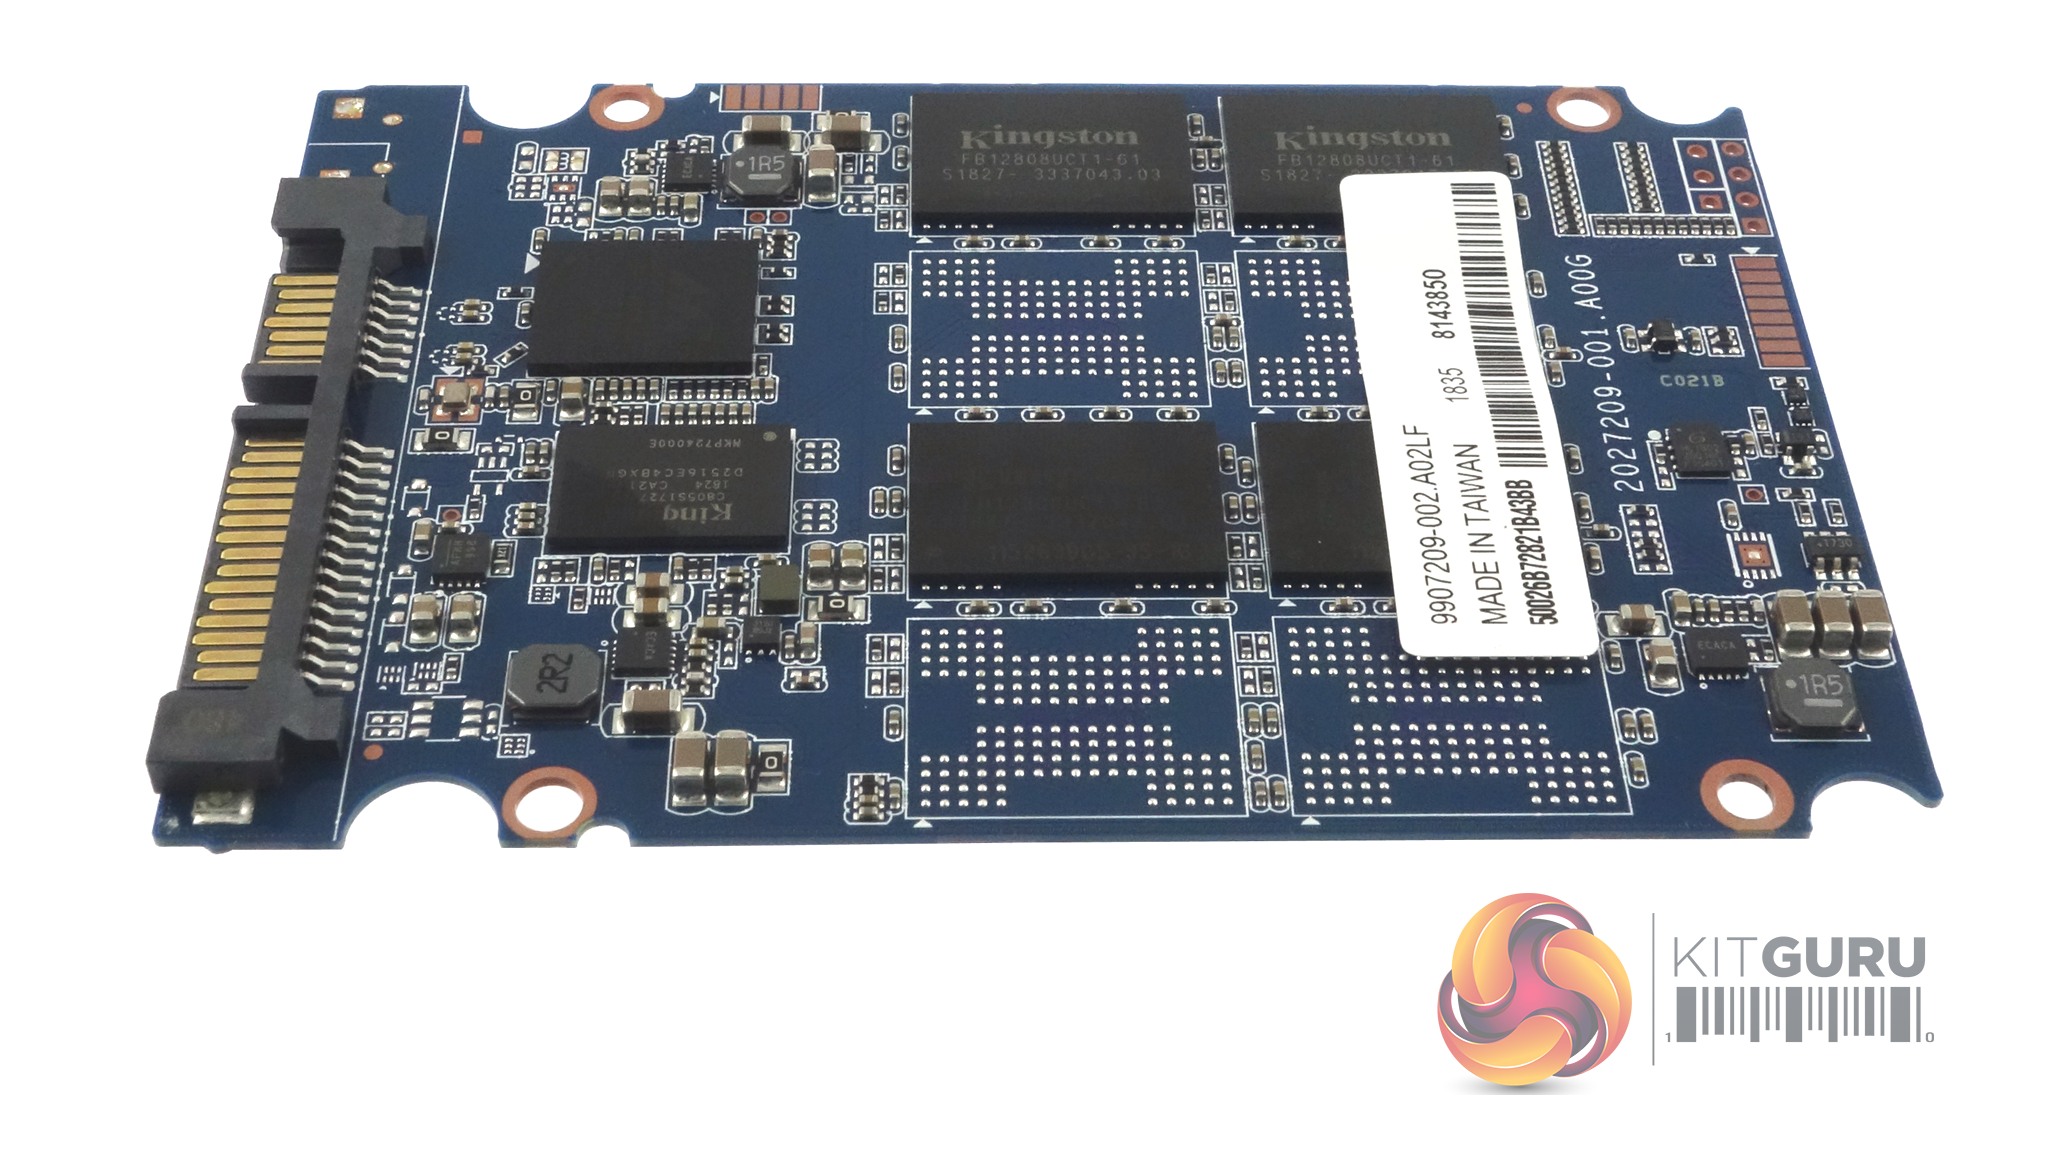
On the other side of the PCB to all those LEDs are the components that really matter. There are four Kingston branded Toshiba BiCS3 64-layer 3D TLC NAND packages along with the Marvell 88SS1074 four channel controller. There's also a DRAM chip.
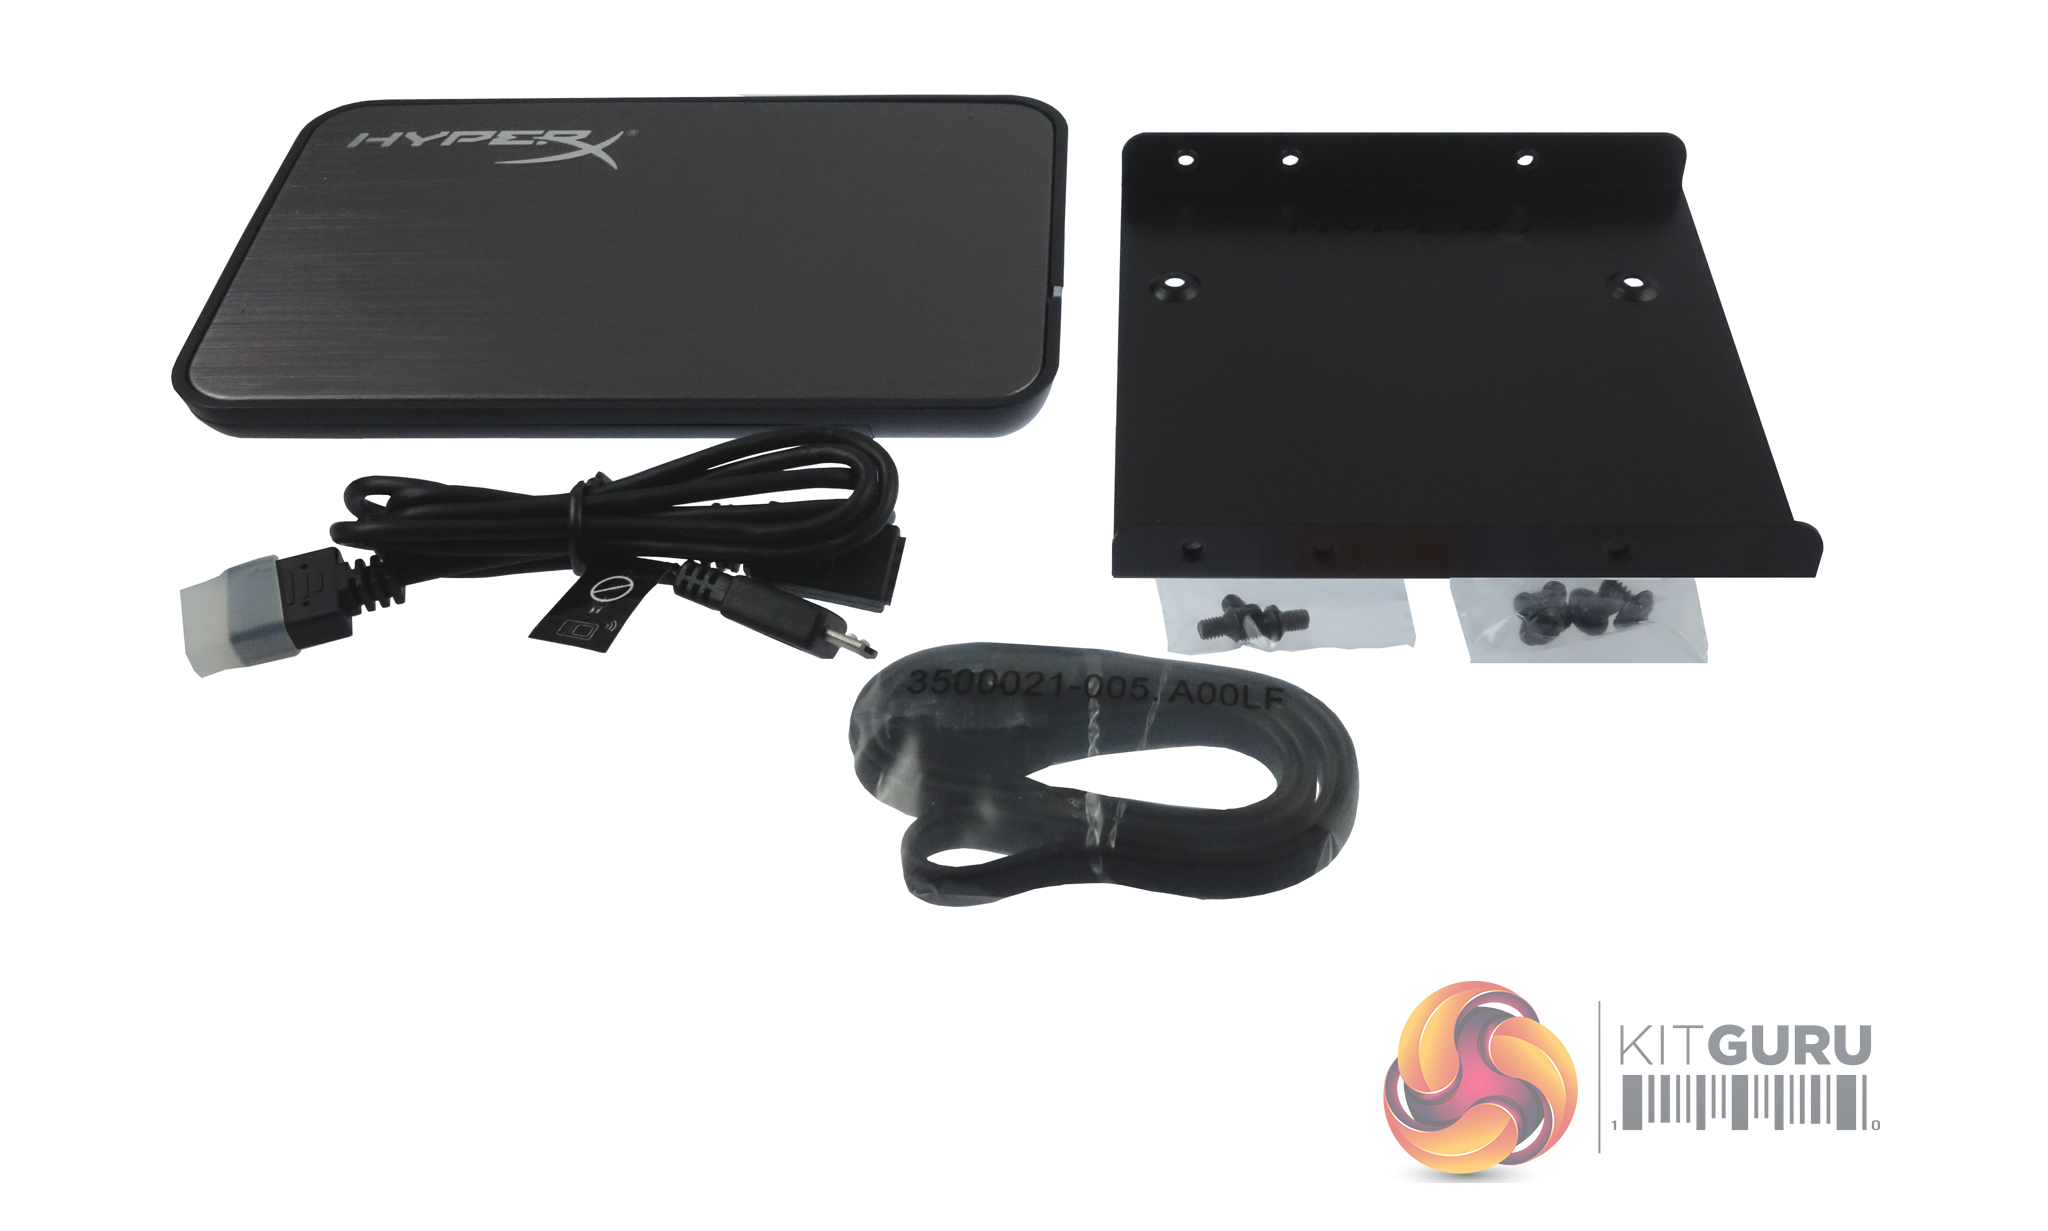
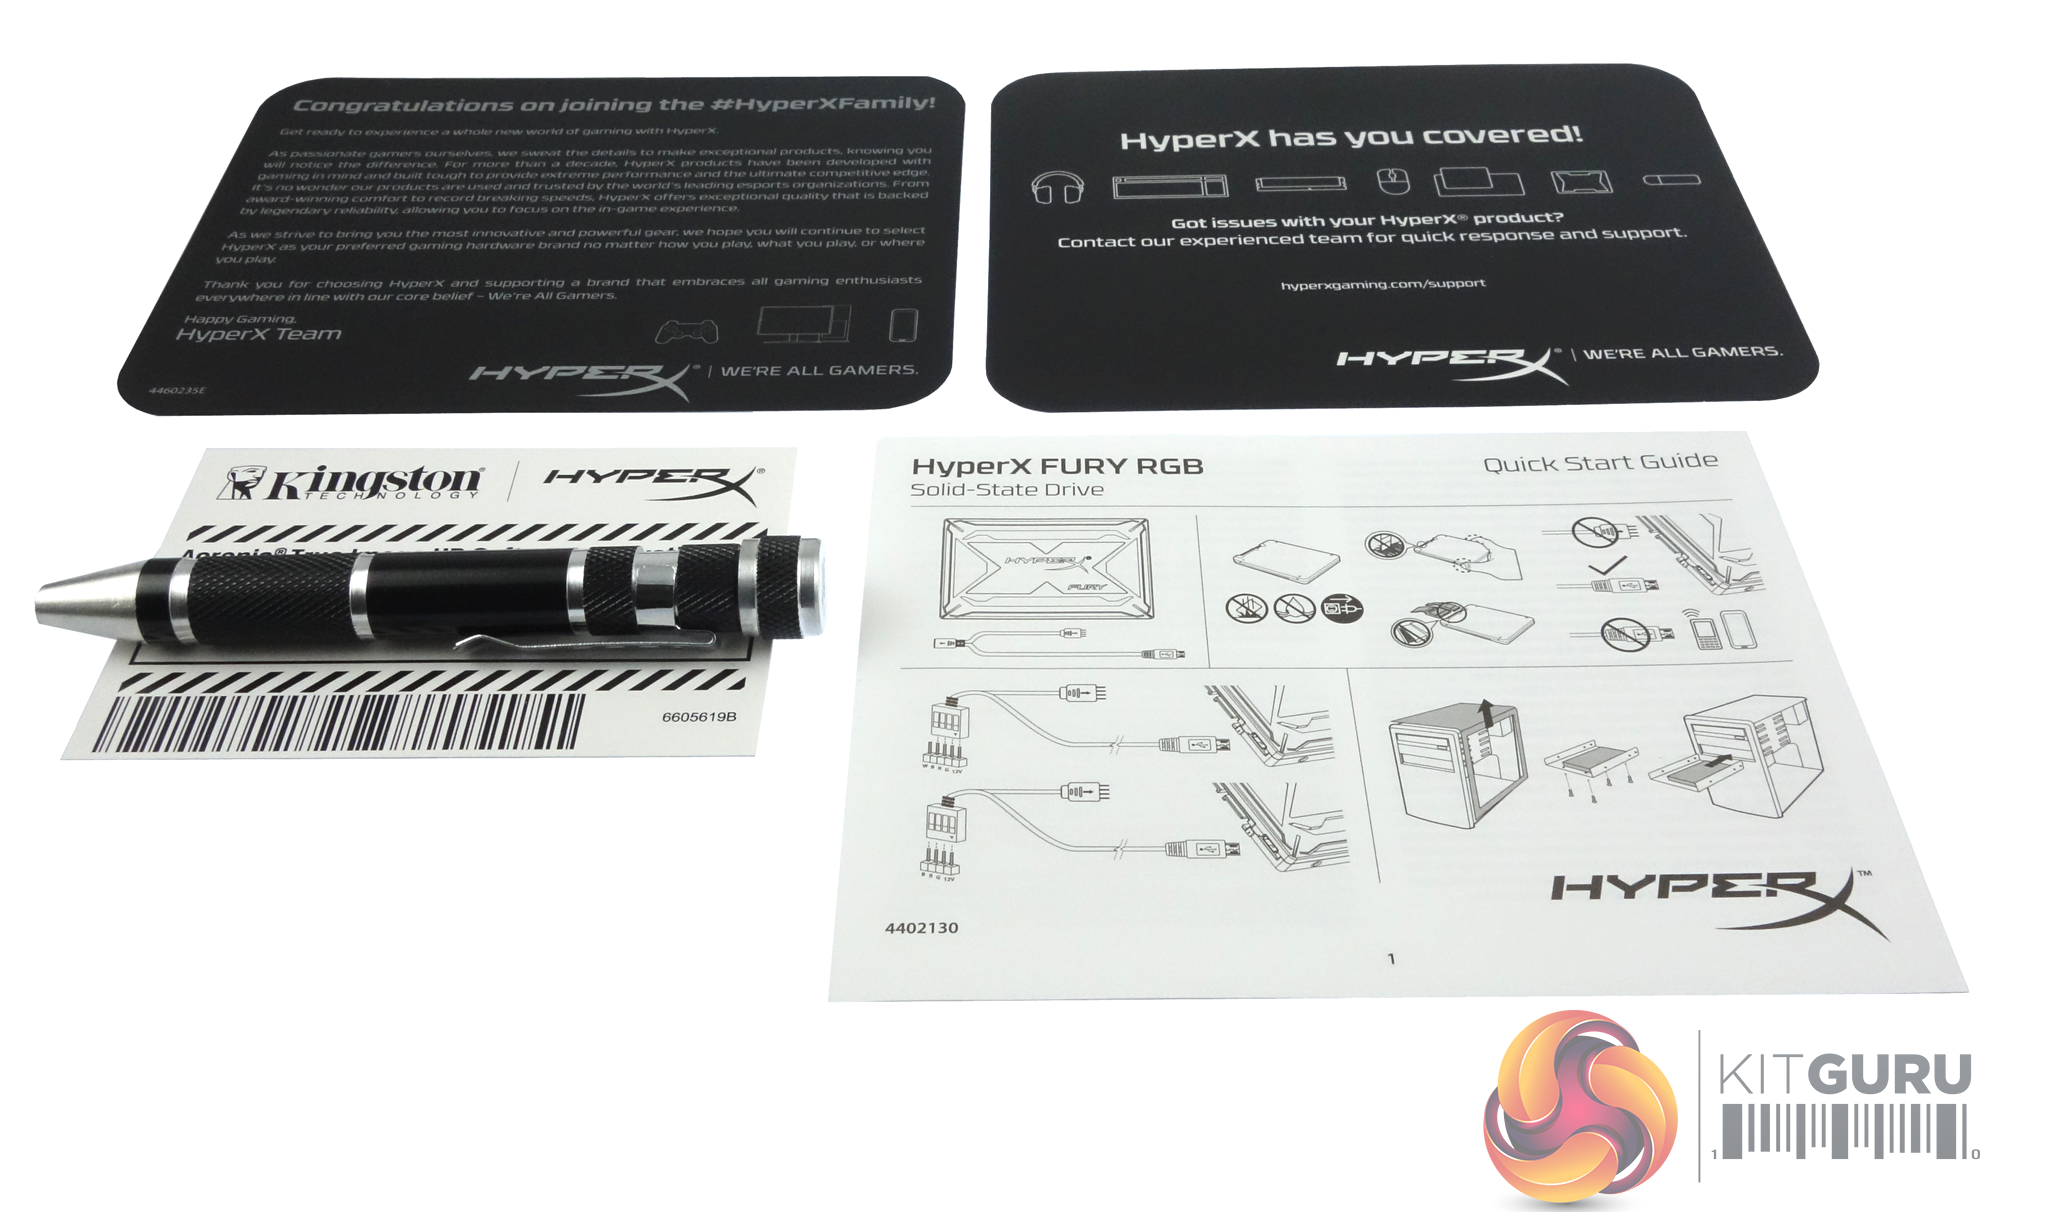
With the Installation kit version of the drive that Kingston supplied us with, there is a box full of bits and bobs. There's a useful 3.5” bracket and mounting screws for installing the drive in a desktop PC and an external USB 3.0 enclosure together with a USB 3.1 type A to mini-USB cable, the RGB connection cable and a neat screwdriver with two bits.
You also get an activation key for Acronis True Image HD cloning software which can be downloaded from the Kingston website. Finally there is a Quick Start Guide and some HyperX marketing material.
For testing, the drives are all wiped and reset to factory settings by HDDerase V4. We try to use free or easily available programs and some real world testing so you can compare our findings against your own system.
This is a good way to measure potential upgrade benefits.
Main system:
Intel Core i7-7700K with 16GB of DDR4-3200 RAM, Sapphire R9 390 Nitro and an Asus Prime Z270-A motherboard.
Other drives
Corsair Neutron XTi 480GB
Crucial BX100 500GB
Crucial BX300 480GB
Crucial MX100 512GB
Crucial MX200 500GB
Intel SSD730 480GB
Kingston HyperX 3K 480GB
Kingston SSDNow KC400 512GB
OCZ Trion 100 480GB
OCZ Trion 150 480GB
Patriot Ignite 480GB
PNY CS2111 XLR8 480GB
Samsung SSD750 EVO 500GB
Samsung 830 512GB
Samsung 840DC EVO 480GB
Samsung 840DC PRO 400GB
SanDisk Extreme Pro 480GB
Seagate 600 480GB
SK hynix Canvas SL300 512GB
SK hynix Canvas SL301 500GB
SK hynix Canvas SL308 500GB
SK hynix SC311 512GB
Toshiba THNSNF512GCSS 512GB
Toshiba OCZ VX500 512GB
Transcend SSD220S 480GB
Transcend SSD370S 512GB
WD Blue 3D NAND 500G
Software:
Atto Disk Benchmark.
CrystalMark 3.0.3.
AS SSD.
IOMeter.
Futuremark PC Mark 8
All our results were achieved by running each test five times with every configuration this ensures that any glitches are removed from the results. Trim is confirmed as running by typing fsutil behavior query disabledeletenotify into the command line. A response of disabledeletenotify =0 confirms TRIM is active.
CrystalDiskMark is a useful benchmark to measure theoretical performance levels of hard drives and SSD’s. We are using
V3.0.3.
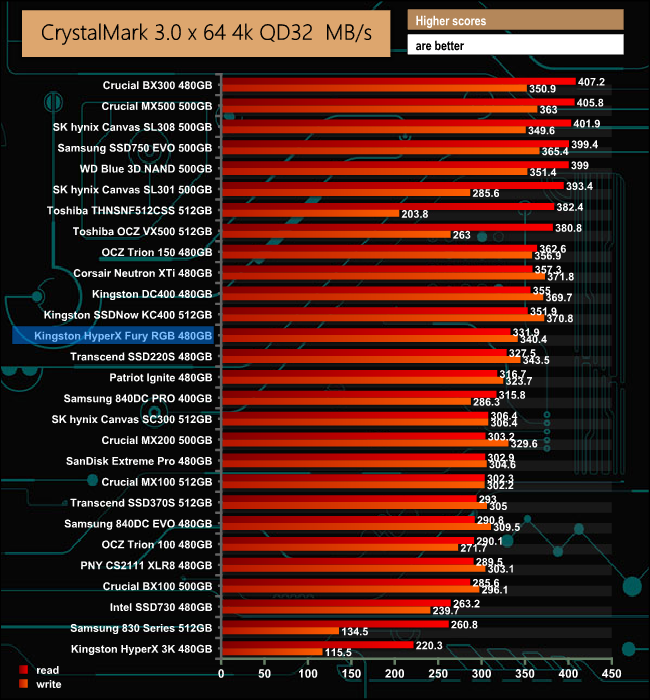
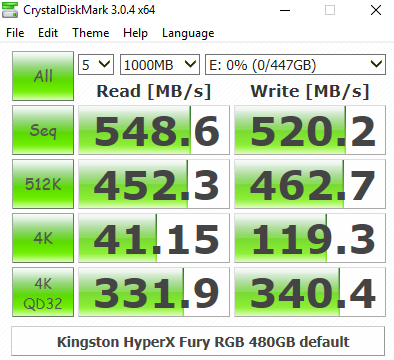
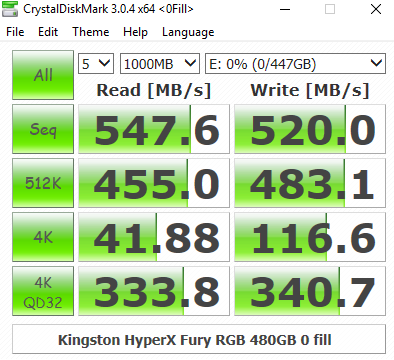
The CrystalDiskMark test results put the drive firmly in the middle of the pack of the 480/512GB drives we've tested. Looking at the two sets of test results, the Marvell 88SS1074 controller doesn't have a preference to which type of data it's being asked to handle.
The ATTO Disk Benchmark performance measurement tool is compatible with Microsoft Windows. Measure your storage systems performance with various transfer sizes and test lengths for reads and writes. Several options are available to customize your performance measurement including queue depth, overlapped I/O and even a comparison mode with the option to run continuously.
Use ATTO Disk Benchmark to test any manufacturers RAID controllers, storage controllers, host adapters, hard drives and SSD drives and notice that ATTO products will consistently provide the highest level of performance to your storage.
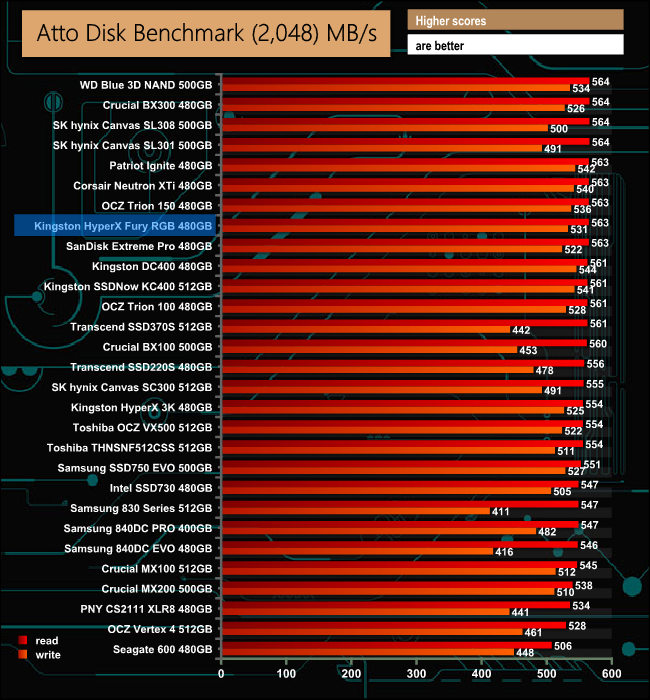
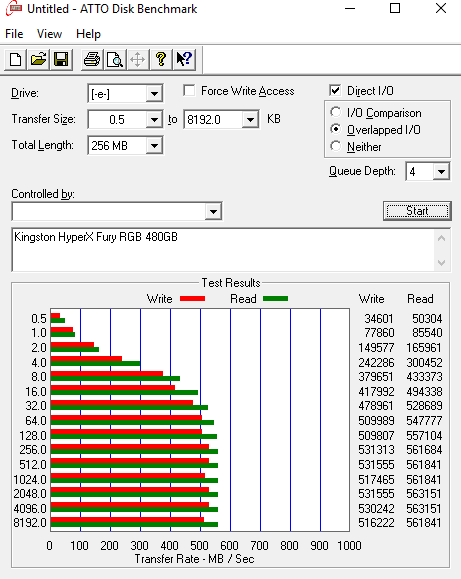
Kingston's official Sequential performance figures for the drive are up to 480MB/s for reads and 500MB/s for writes. With the ATTO benchmark we were able to better both of those figures with reads at 563MB/s and writes at 531MB/s.
AS SSD is a great free tool designed just for benching Solid State Drives. It performs an array of sequential read and write tests, as well as random read and write tests with sequential access times over a portion of the drive. AS SSD includes a sub suite of benchmarks with various file pattern algorithms but this is difficult in trying to judge accurate performance figures. 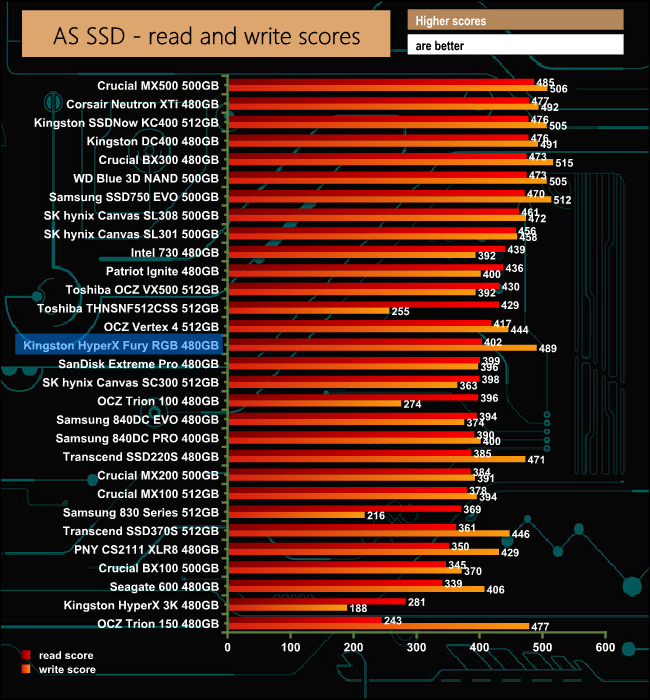
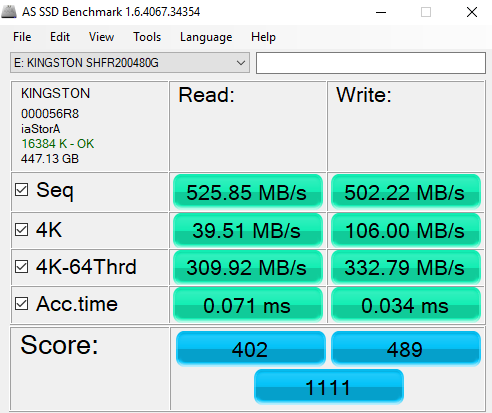
The HyperX Fury RGB sits in the middle of the pack of our tested drives in the 480GB-512GB capacity range with a read score of 402 from the AS SSD benchmark. Having said that, the write score of 489 is impressive.
IOMeter is another open source synthetic benchmarking tool which is able to simulate the various loads placed on hard drive and solid state drive technology.
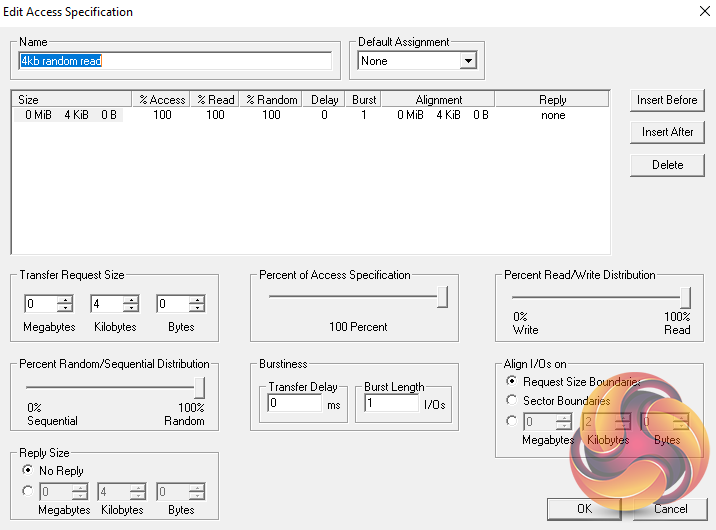
We test with both random read and write 4k tests, as shown above. There are many ways to measure the IOPS performance of a Solid State Drive, so our results will sometimes differ from manufacturer’s quoted ratings. We do test all drives in exactly the same way, so the results are directly comparable.
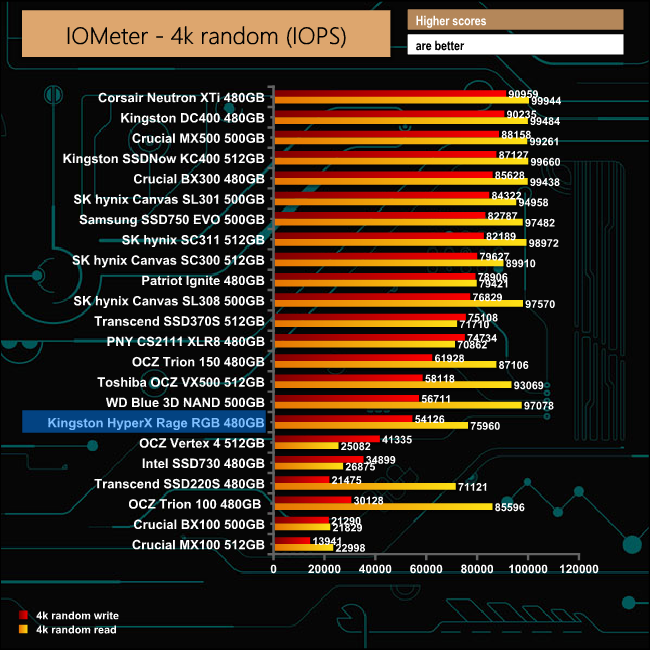
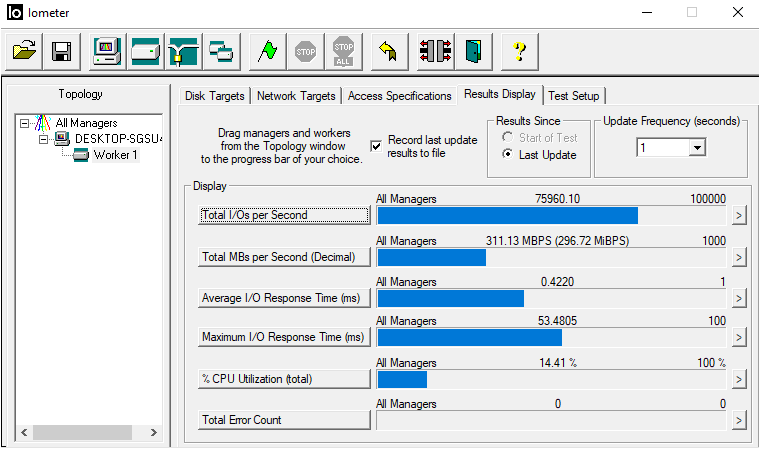
Despite carrying Kingston's HyperX performance branding, the 4K random read/write performance of the drive isn't really that impressive, the review drive producing 75,960 IOPS for reads and 54,126 IOPS for writes in our 4K performance tests.
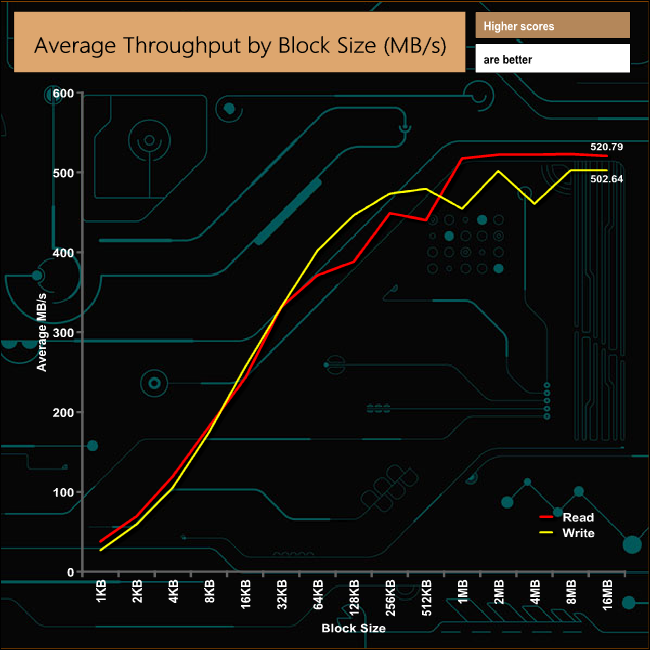
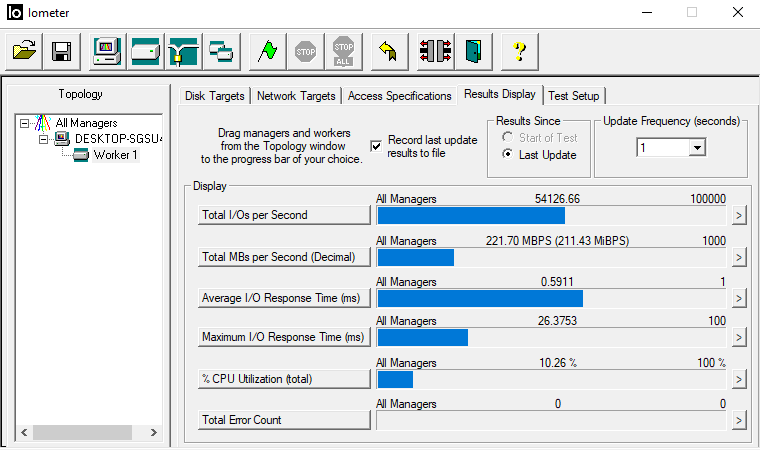
In our throughput test the drive peaked at 523.21MB/s (8MB block) during the read test before dropping back to finish the run at 520.79MB/s, both of these figures being faster than the official 480MB/s.
When it came to writes the drive peaked at 502.77MB/s, again at the 8MB block mark but this time the tested figure was somewhat shy of the official 550MB/s.
Futuremark’s PCMark 8 is a very good all round system benchmark but it’s Storage Consistency Test takes it to whole new level when testing SSD drives. It runs through four phases; Preconditioning, Degradation, Steady State, Recovery and finally Clean Up. During the Degradation, Steady State and Recovery phases it runs performance tests using the 10 software programs that form the backbone of PCMark 8; Adobe After Effects, Illustrator, InDesign, Photoshop Heavy and Photoshop Light, Microsoft Excel, PowerPoint, Word, Battlefield 3 and World of Warcraft. With some 18 phases of testing, this test can take many hours to run.
Preconditioning
The drive is written sequentially through up to the reported capacity with random data, write size of 256 × 512 = 131,072 bytes. This is done twice.
Degradation
Run writes of random size between 8 × 512 and 2048 × 512 bytes on random offsets for 10 minutes. It then runs a performance test. These two actions are then repeated 8 times and on each pass the duration of random writes is increased by 5 minutes.
Steady State
Run writes of random size between 8 × 512 and 2048 × 512 bytes on random offsets for final duration achieved in degradation phase. A performance test is then run. These actions are then re-run five times.
Recovery
The drive is idled for 5 minutes. Then a performance test is run. These actions are then repeated five times.
Clean Up
The drive is written through sequentially up to the reported capacity with zero data, write size of 256 × 512 = 131,072 bytes.
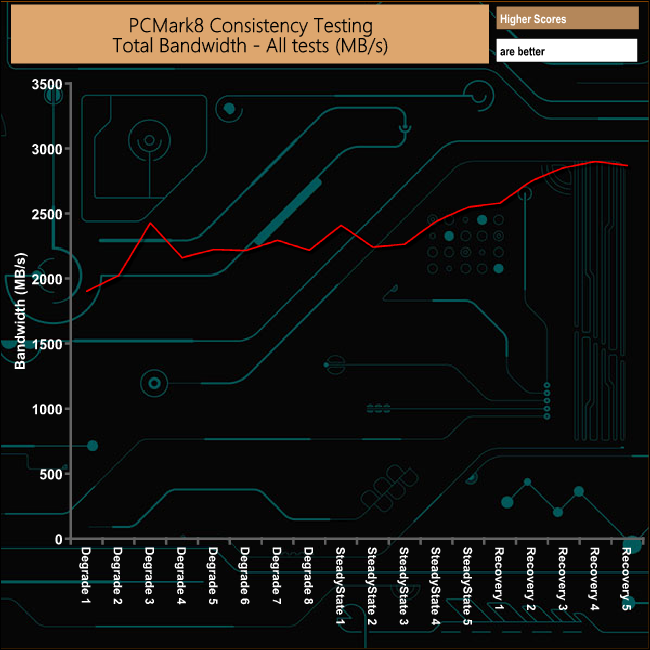

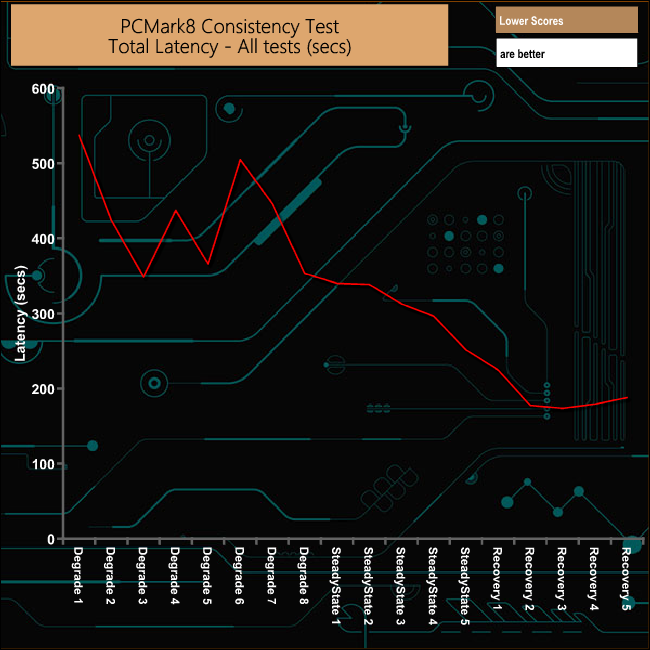
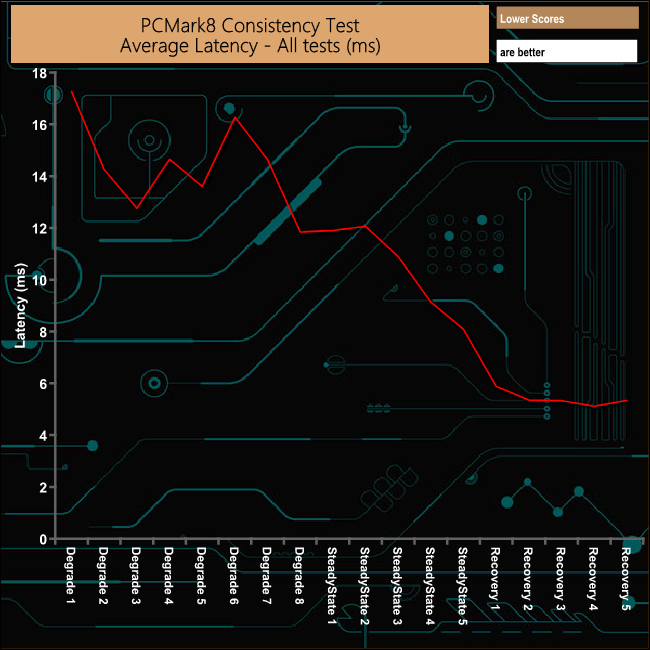
Overall the drive did pretty well in PCMark 8's Consistency test. It did suffer through the opening Degradation and SteadyState phases but recovered well from the ordeal.
PCMark 8’s Consistency test provides a huge amount of performance data, so here we’ve looked a little closer at how the 480GB Kingston HyperX Rage RGB performs in each of the benchmarks test suites.
Adobe Creative Cloud
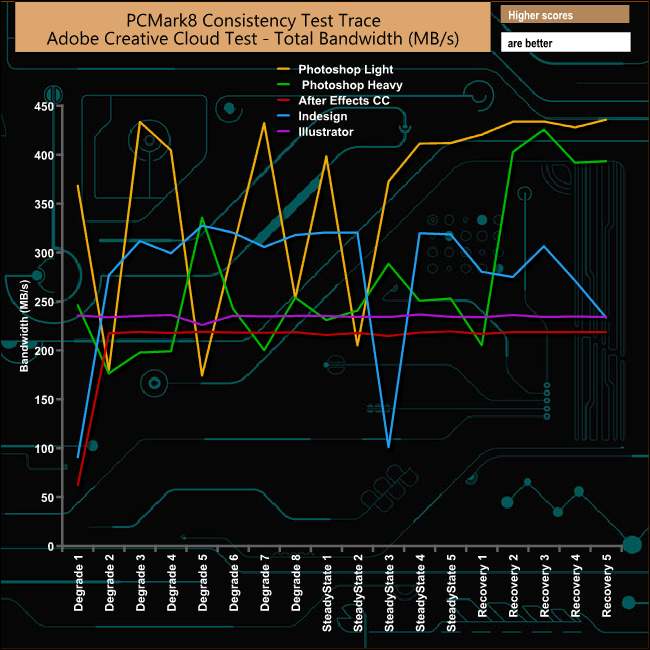
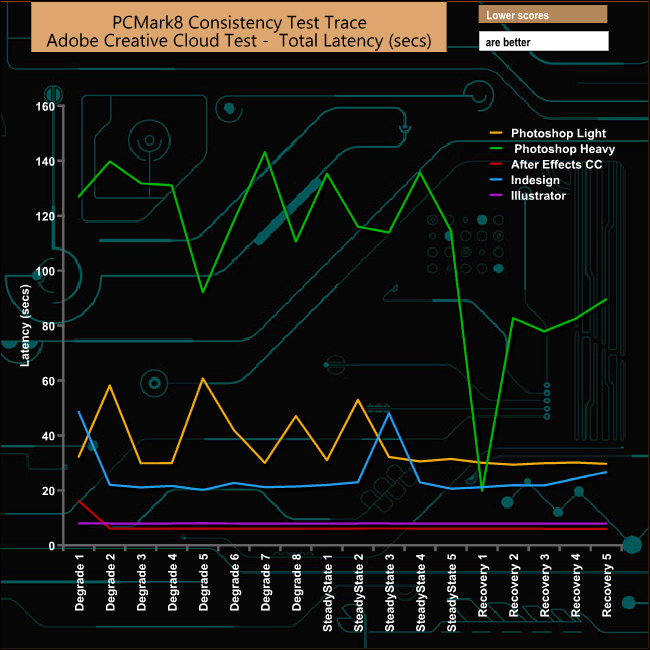
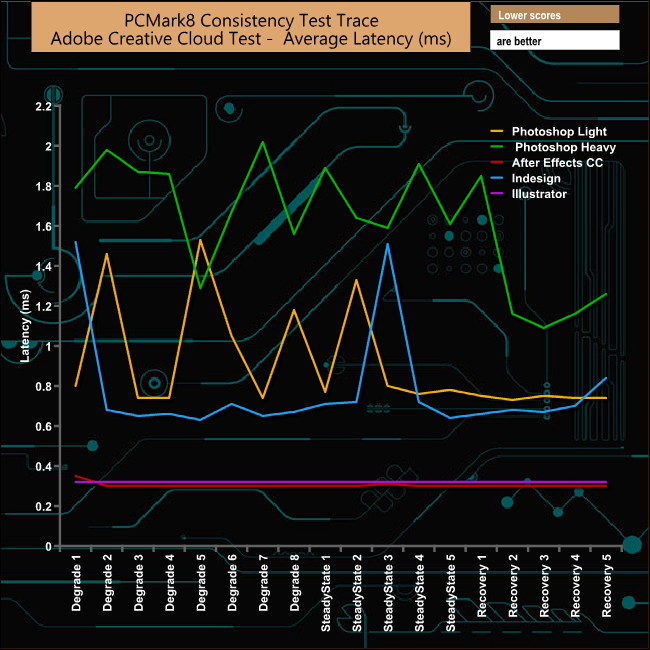
The drives performance gets a real hammering in both Photoshop and the Indesign test traces although it recovers better in both Photoshop tests, the recovery is anything but consistent.
Microsoft Office
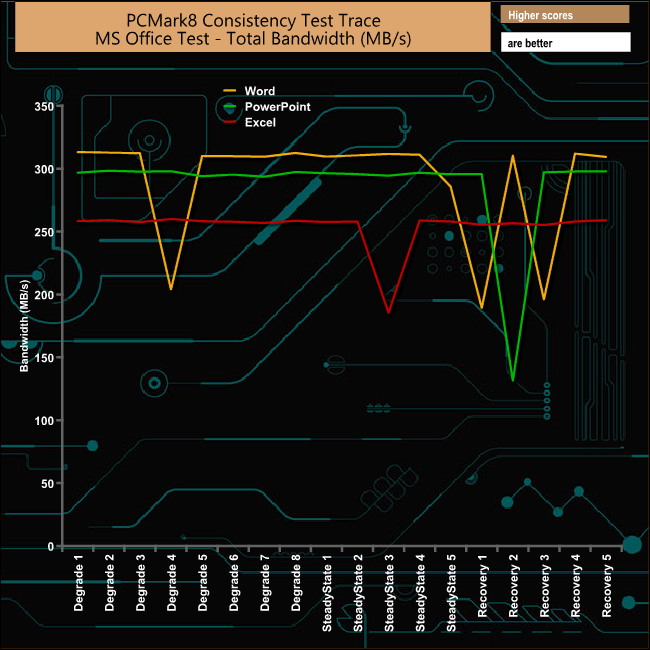
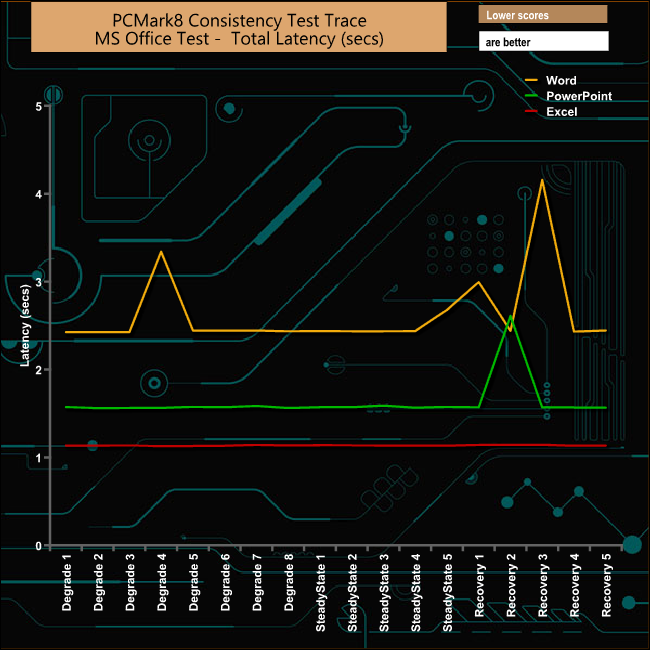
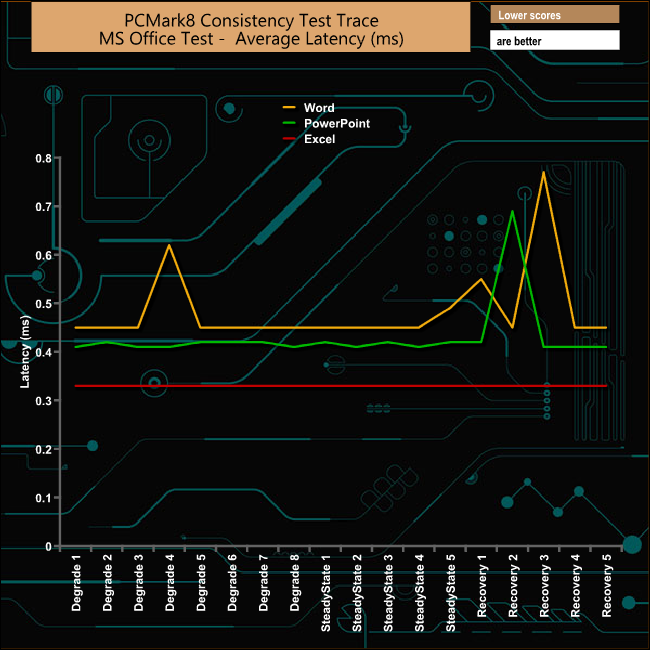
Very oddly in the Microsoft Office test traces, the drives performance suffers the most during the recovery phases in both the Word and Powerpoint tests. In the Excel test the drive suffers a dip in performance during the Steady State 3 run but very quickly recovers.
Casual Gaming
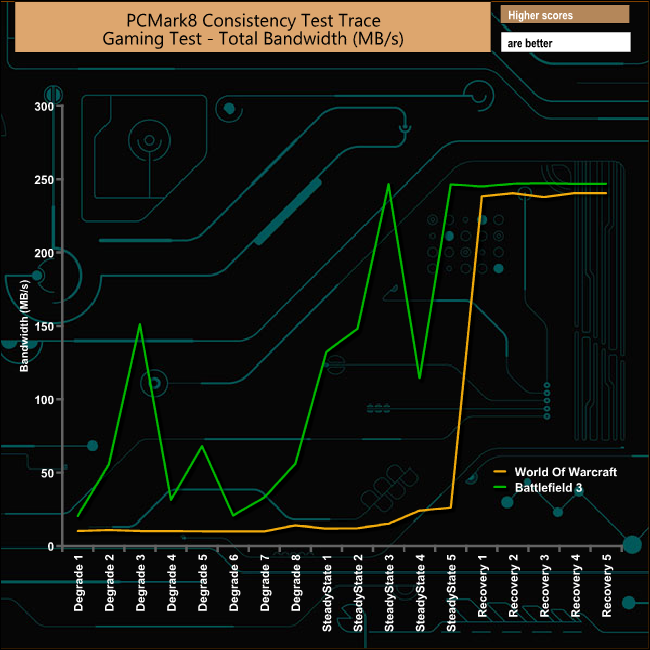
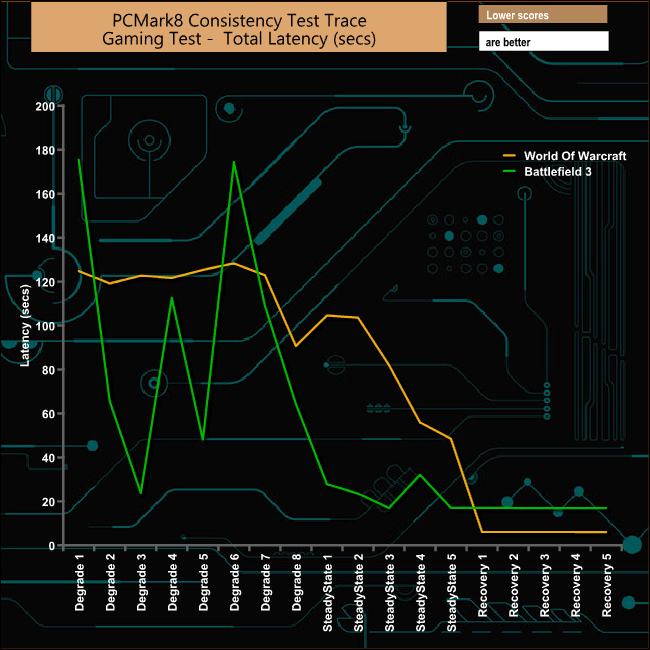
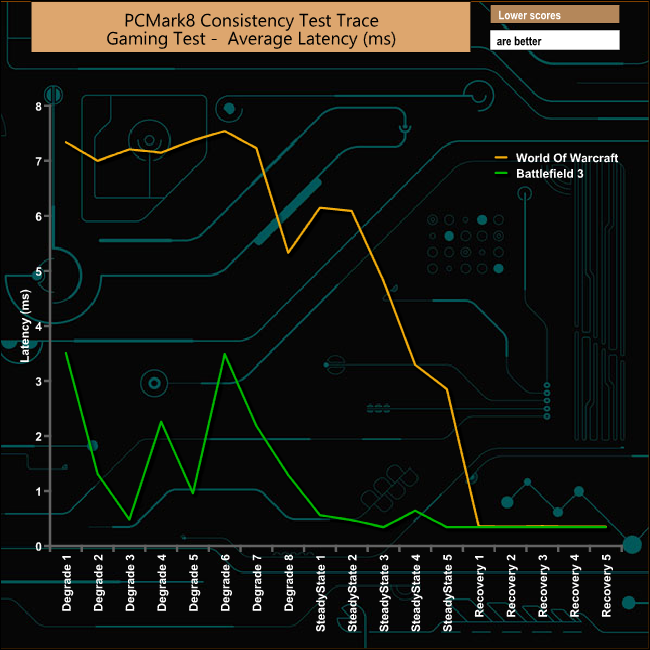
Out of the two gaming traces it's the Battlefied 3 one that causes the most problems for the drive. Having said that the drive doesn't perform that well in the World Of Warcraft either with low bandwidths throughout the test but it does recover from this test particularly well.
Just like the Consistency test, PCMark 8’s standard Storage test also saves a large amount of performance data. The default test runs through the test suite of 10 applications three times. Here we show the total bandwidth performance for each of the individual test suites for the third and final benchmark run.
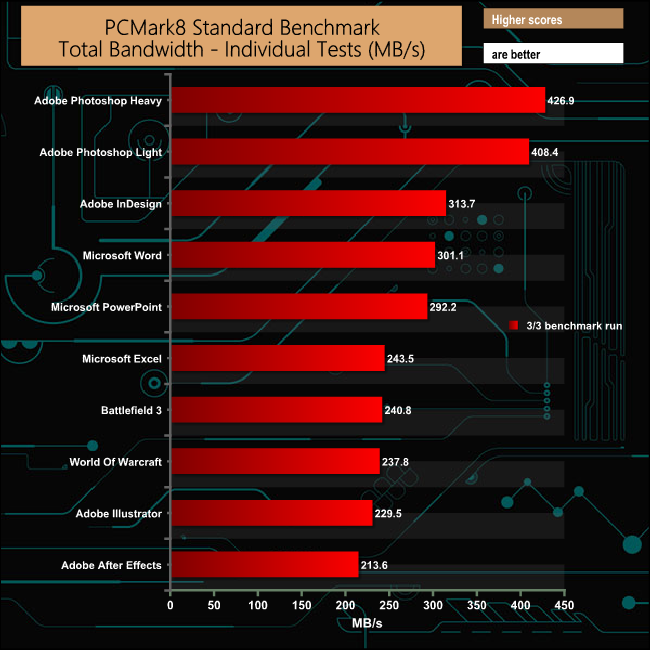
The drive shows some pretty strong bandwidth figures for this class of drive in the standard PCMark 8 Storage test especially when dealing with the two Adobe Photoshop tests.
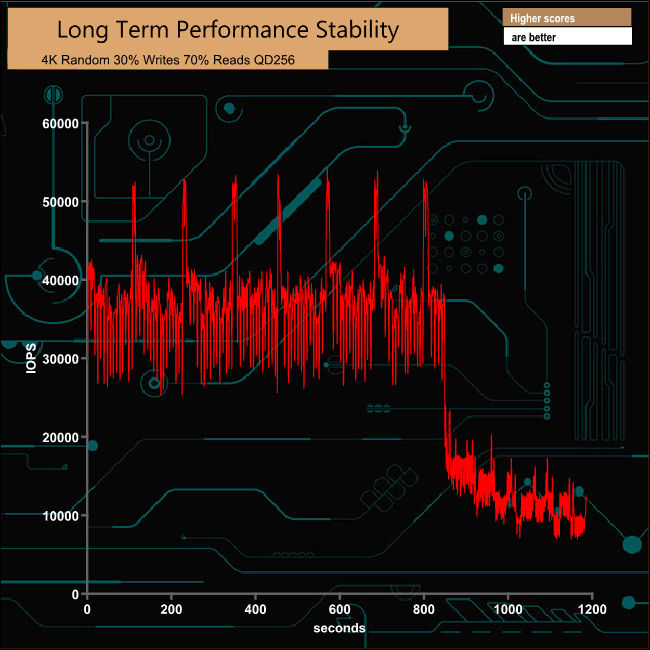
For the long term performance stability test, we set the drive up to run a 20-minute 4K random test with a 30% write, 70% read split, at a Queue Depth of 256 over the entire disk.
The 480GB Kingston HyperX Fury RGB averaged 30,659 IOPS for the test with a performance stability of 58.47% which is pretty good for this class of drive.
To test real life performance of a drive we use a mix of folder/file types and by using the FastCopy utility (which gives a time as well as MB/s result) we record the performance of drive reading from & writing to a 256GB Samsung SSD850 PRO.
100GB data file.
60GB iso image.
60GB Steam folder – 29,521 files.
50GB File folder – 28,523 files.
12GB Movie folder – 24 files (mix of Blu-ray and 4K files).
10GB Photo folder – 621 files (mix of .png, raw and .jpeg images).
10GB Audio folder – 1,483 files (mix of mp3 and .flac files).
5GB (1.5bn pixel) photo.
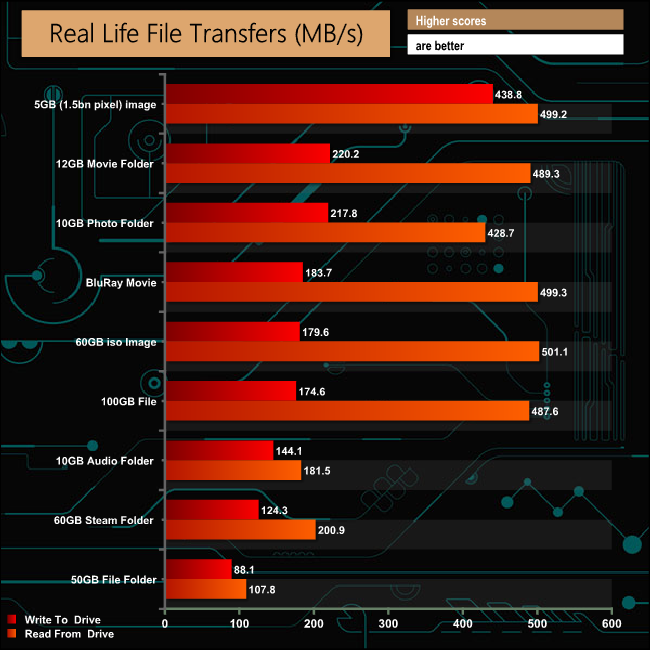
The drive had no problems dealing with our real life file transfer tests although the read performance was much stronger than the write throughout the test.
It was only a matter of time before SSD drives got a funky RGB lighting scheme – after all the technology has somehow made it into every other area of a PC, so why not a drive? Whether you take a look at the flashing multicoloured lightshow and wonder the point or if you just love the technology, it's pretty much here to stay by the looks of it.
Kingston's latest 2.5in SSD, the HyperX Fury RGB is one of the very rare breed (at the time of writing) of drive that has RGB built in.
The quoted Sequential performance of the HyperX RGB is pretty much what you would expect for a SATA interfaced SSD using a four channel controller and 3D TLC NAND; up to 480MB/s for reads and 500MB/s for writes. Using the ATTO benchmark we were able to squeeze a bit more out of the review drive, especially when it came to read performance at 563MB/s while the tested write performance came in at 531MB/s.
All those 75 LEDs inside the drive keep it nice and toasty when it's being pushed. With our test system just ticking over the drive was recorded at 27°C but when it was running our 4K read/writes tests this increased to 46°C. This may not sound like much but the previous Kingston drive we tested, the 960GB UV500, uses the same type of NAND and controller combination and was 25°C on idle and only reached 32°C when performing the same 4K read/write tests.
According to Kingston's website the drive is compatible with the Asus Aura Sync, ASRocks Sync, MSI Mystic Light Sync and Gigabyte RGB Fusion RGB technologies.
The elephant in the room is the pricing. The basic 480GB model costs £129 which pits it against some much higher performing SATA drives. It is also more expensive than Kingston's own 480GB UV500 drive. To make matters worse it is around £20 more expensive than the 480GB model of Kingston's own entry-level M.2 NVMe drive, the A1000.
The upgrade version of the HyperX Fury RGB 480GB that Kingston supplied for this review costs even more at £146. Kingston needs to shave a fair bit of the price to make the drive competitive regardless of the RGB technology.
We found the Kingston HyperX Fury RGB 480GB Installation Kit (SHFR200B/480G) on Span.com for £146.40 HERE
Pros
- Sequential performance.
- Free cloning software.
- Upgrade provides useful extras.
- RGB features will target a specific audience.
Cons
- Right now it is very expensive.
- 4K read/write performance.
Kitguru says: If Kingston's HyperX range is all about high performance then the HyperX Fury RGB is a bit of an odd fit. Its performance doesn't match up to the visual impact of the RGB and it's the RGB that adds quite some premium on the price.

Be sure to check out our sponsors store EKWB here