Article

A Holonic Construction Management System for the Efficient Implementation of Building Energy Renovation Actions

1
Construction Division, DICEA Department, Faculty of Engineering, Università Politecnica delle Marche, 60131 Ancona, Italy
2
General Directorate of Architecture and Building Quality, Junta de Extremadura (JEA), Ministry of Mobility, Transport and Housing, Regional Government of Extremadura, 06800 Merida, Spain
*
Author to whom correspondence should be addressed.
Sustainability 2024, 16(5), 1824; https://doi.org/10.3390/su16051824
Submission received: 23 December 2023 / Revised: 6 February 2024 / Accepted: 16 February 2024 / Published: 22 February 2024

Abstract

:
In the architecture, engineering and construction (AEC) industry, many efforts have provided remarkable contributions to construction planning and control processes during work execution. Nevertheless, frequent coordination issues among stakeholders and difficulties in dealing with unexpected events can be explained by the complexity featuring the construction sector. Several approaches to deal with this issue were investigated in the manufacturing area, among which this paper looks at the holonic approach as one of the most promising strategies. This study first analyzes the more fragmented and dynamic nature of the construction industry as compared with the manufacturing one. Secondly, it suggests developing a process-based holonic construction management system based on building information modeling (BIM) and a conceptual architecture for manufacturing control called Product Resource Order Staff Architecture (PROSA). The process-based paradigm ensures exploiting the benefits of BIM towards the development of sustainable and efficient regeneration methods of the built environment. Subsequently, a first management system prototype was developed and tested for the purpose of renovation works management. For the first time, results from an actual implementation of PROSA were applied to a real construction site, and its feasibility was assessed using the data on the field. Key performance indicators (KPIs) evaluated during the onsite demonstration confirmed a good performance of PROSA and the presented holonic approach, which contributed to the overall success of the energy efficient refurbishment project.

1. Introduction

In the AEC industry, insiders have made huge efforts across decades in the planning and monitoring phases of the construction process. Despite remarkable progress, there are still some open challenges that offer opportunities for improvement. To fully understand the reasons behind these open issues, some typical characteristics of the construction industry must be commented on, along with the common attitudes of professionals. In fact, the nature of the construction industry itself makes coordination between stakeholders difficult [1]. The multitude of involved actors interacting with each other, making the construction process a complex socio-technical system, must be considered [2,3,4]. This is even more evident in the case of renovation works, when the building may be partially used while the refurbishment works are underway, adding to the complexity of coordinating the working actors with the building users. A complex system consists of many elements affected by non-linear interactions. As such, small causes may lead to large consequences, and vice versa, meaning that it is difficult to predict related events [5]. Examples of unpredictable events affecting the construction process are bad weather conditions, work site accidents, supply chain delays, and productivity rates variation [3,4]. This implies flow variability that negatively impacts project performance and productivity [6,7], and requires frequent and demanding updates of the construction schedule [3]. Among common attitudes, it is worth mentioning that methodologies and tools conceived for general project management are very often used to support site management [3]. Although these tools can provide a successful contribution in the first domain, they cannot guarantee proper support to deal with the complexity of the replanning phase during construction management. Hence, the construction industry lacks adequate methodologies for managing construction processes that can effectively address their complexity through effective and not too demanding replanning actions. This shortfall emphasizes the critical need for innovative solutions that are capable of dynamically adapting to the evolving changes and challenges that are typical in construction projects.
Other industry sectors, such as the manufacturing one, have already started dealing with complexity. In this attempt, one of the candidate strategies is the holonic theory. A holonic conceptual architecture for manufacturing control is the Product Resource Order Staff Architecture (PROSA). Every elementary holon defined in PROSA (i.e., product, resource, and order holons) is responsible for one aspect of manufacturing control, be it logistics, technological planning, or resource capabilities, respectively, whereas the staff holon can be added to assist the basic holons with expert knowledge [8]. In the attempt to adopt PROSA in the construction domain, the differences between the AEC and manufacturing industries must be considered. In fact, the construction industry is usually more fragmented than the manufacturing industry [3], and flows of processes and operations do not coexist resulting in a batch production mode [7]. In construction sites, unlike manufacturing ones, which are characterized by strict assembly lines, work spaces are both dynamic and contextual entities that must be considered limited resources [9].
Therefore, this study, while acknowledging the differences between the construction and manufacturing sectors, aims to leverage the experience gained in the manufacturing industry in managing complex scenarios. To pursue this objective, a holonic construction management system, based on PROSA, integrating a stigmergic algorithm for quick replanning, was developed to support construction management complexity. Construction fragmentation was addressed by modeling production flows as processes that provide the input for automatic replanning. In order to detect spatial interferences that may have been included in the resulting work plans, the replanning tool was integrated with a spatial conflicts simulator. Onsite tests of the proposed system were carried out to coordinate actual energy efficiency renovation works on a real experimental building located in Cáceres (Spain). This enabled an initial application of PROSA, and evidence regarding its applicability in the construction was collected.
The remainder of this paper is organized as follows. An overview of traditional and advanced construction project planning and scheduling approaches and the research questions answered by this study are reported as follows in this section. The Materials and Methods section introduces a novel workflow based on the holonic theory. Experiments design and results are then reported, followed by the Discussion section. Conclusions are provided at the end of the paper along with the limitations of the study and future research directions.

1.1. Traditional Construction Project Planning and Scheduling

Several construction project planning and scheduling methodologies have been proposed over the years. Whereas some of them are quite general and can be applied to different construction projects domains, some others can be applied to a limited set. This section first provides an overview of the theoretical approaches known in the literature and then introduces methods proposed by research studies and commercial tools.

1.1.1. Theoretical Approaches

Categorization assigns theoretical approaches for construction management to three groups: “activity-based”, “location-based”, and “object-based” [3]. These approaches, which have made significant contributions to the body of knowledge, represent the cornerstones of construction project scheduling and planning. “Activity-based” methodologies conceive the activity as the main element used to plan construction processes and focus on the works to be performed. In this category, the most important methodologies are the Critical Path Method (CPM), Earned Value Analysis (EVA), and Last Planner System (LPS). “Activity-based” methodologies have paved the way for the automatic computation of project duration, the effects of activities slippage, early problem signaling and have also ensured a reduction in waste, rework, and trade waiting times.
Further benefits could be provided by integrating such methodologies with approaches that consider work spaces as resources. The answer to fill this gap comes from the so-called “location-based” methodologies that support the identification of collision and crew obstructions. In “location-based” methodologies, the basis for construction planning is the physical location of the building where the work needs to be performed [3]. In this category, the most important methodologies are Line of Balance (LOB), Flowline, and Location-Based Management System (LBMS). It must be clarified that such methodologies give their best in case of repetitive construction projects. In fact, the LOB technique was specifically implemented in construction for managing linear construction projects. Similarly, the Flowline and LBMS methods are usually applied in cyclic building projects with highly repetitive processes, such as high-rise buildings [3].
In addition, the graphical representation offered by the “Location-based” methodologies increases transparency and comprehension of the construction workflow, thus supporting its improvement. Such advances can be even more beneficial if combined with the data management offered by the “object-based” approaches. “Object-based” methodologies focus on the different parts that need to be installed [3]. Building Information Modeling (BIM) is interpreted as a methodology rather than as a tool to enable the digital modeling of a building. The application of BIM in supporting construction processes has been documented in large-scale high-rise buildings like multi-residential houses [10] or medium-to-large-scale health-care projects [11,12]. The three-dimensional visualization of the building ensures a better comprehension of the construction sequence. This aspect could be improved even more by adopting a process-based approach. In fact, detailed modeling of the execution process would improve construction process management and progress monitoring [3].

1.1.2. Experimental Approaches and Commercial Tools

Over the last decades, many efforts have been made by researchers and software houses in developing tools aiming to facilitate construction project management. The main contributions of past studies can be grouped into the fields of construction planning and work plan validation.
In the field of construction planning, examples of tools that implement lean construction flow control are WorkPlan [13] and the commercial package that helps to reduce supply chain variations, called Strategic Project Solutions (SPS) [14]. Since such tools do not integrate building models to support visualization, several studies based on lean principles have tried to overcome this limitation. Examples are the Lean Enterprise Web-based Information System (LEWIS) [15] and a BIM-enabled system called KanBIM [1]. Nevertheless, there is a need for the further development of tools, like KanBIM, that consider BIM models only as a three-dimensional visual information source and visualization method. This gap was addressed by BeaM! [16] and the BIM-based LPS tool [17]. These are production management systems based on the Last Planner System principles, which aim to foster the use of the data within the BIM models to streamline process planning on the construction site. Another visual production system was presented by [18], who developed a BIM-based visual and virtual project control system that proactively promotes team-based planning and real-time communication of progress and schedule risk. Refs. [19,20] implemented a process-based simulation toolkit and a collaborative platform, demonstrating that a multi-model (i.e., product and process models) data integration approach can be applied to manage and integrate project data with a simulation framework. In particular, formal business process models based on Business Process Model Notation (BPMN) have been used to capture and organize knowledge in the construction domain, providing the ability to directly transform these models into a simulation process. Several commercial BIM–Lean IT tools have been released on the market. Autodesk BIM360 Plan, one of the most widely accepted by the industry [16], is a cloud-based solution based on LPS principles, which supports construction production planning and control [21]. Its main limitation is that the process perspective is very much separated from the product perspective. In fact, process entities cannot be directly linked to BIM objects. This gap is filled by another web-based lean tool, namely LCM digital, where activities can be linked to BIM models via the activity ID, enabling quantity extraction and activity monitoring [22].
As proved by the aforementioned studies, LPS has been applied widely to reduce variation, improve coordination and workflow, and thus to reduce various forms of waste in construction projects. Despite the significant contributions, some open gaps are still waiting to be filled. It is a fact that coordinating extended weekly team meetings is a costly effort due to a large number of project participants involved [23]. In addition, the weekly response time is too long when having to deal with unexpected events that require immediate action [1]. Finally, the process-based approach introduced by [19,20,22] should be further exploited to be combined with planning algorithms. Several benefits are expected to be provided by applying a similar approach. For example, planning engineers would be asked to provide only technical constraints, leaving planning algorithms the possibility to optimize the plan based on discretionary decisions. Moreover, construction sequences described by a machine-readable process notation, e.g., BPMN, could be reused for each re-planning action, avoiding the tediousness of redefining them from scratch at every iteration of the planning process and thus speeding up replanning actions. Machine-readable description of construction processes using BPMN also proved useful also in monitoring and sharing the work progress advances using distributed ledgers trusted by all the stakeholders collaborating on a given construction site.
Significant contributions have also been registered also in the field of the spatial validation of construction work plans to support workspace management. Some of the developed tools are low tech, while some others use more advanced technologies. In the first category, there are the tools based on Microsoft Excel [24] provided by [25,26]. Although the use of a widespread tool like Microsoft Excel enables all construction practitioners to apply this approach, 2D spatial representation may represent a limitation and cause failures in the detection of spatial interferences. This gap has been filled with the use of more advanced technologies for workspace management. A series of studies has developed several spatial validation tools of construction work plans to support workspace management. These studies apply different combination of the most advanced technologies, such as 4D-BIM [9], VR/AR [27], serious game engines [28], and Bayesian inference techniques [29].
Nowadays, several 4D tools are available on the market, providing different levels of capabilities and toolkits (e.g., Vico Schedule Planner and 4D Player, Innovaya Visual 4D Simulation, Autodesk Navisworks, Synchro Pro, and Elecosoft Powerproject BIM). Autodesk Navisworks and Synchro Pro, which can be considered the most popular ones, have been exhaustively compared [29,30,31]. On the other hand, Autodesk Navisworks is recommended more for running clash detection tests between single building elements; to adjust the building design and avoid spatial issues, Synchro Pro is better for checking spatial interferences during the construction process and adjusting the work schedule accordingly [32].
Significant attempts in automating the spatial validation of construction work plans, with the consequent reduction in analysis time and the improvement in quality, have resulted from past studies. In spite of the success of such a line of research, some open gaps are still waiting to be filled. First of all, spatial conflicts among incompatible workspaces (e.g., electrical hazards and dust spreading) represent an open issue. In addition, since they may include spatial interferences, work plans resulting from automatic replanning tools must be validated before giving directions to the construction site. Hence, integrating spatial analysis with automatic replanning represents a significant opportunity to deliver effectively feasible work plans to the construction site.

1.2. Holonic Construction Management

The AEC industry has the reputation of being a complex socio/technical system affected by frequent unexpected events [2,4]. In fact, as is the case in any complex system, many elements are involved and affected by non-linear interactions, meaning that small causes may lead to large consequences, and vice versa [5]. This implies a non-immediate relationship between causes and effects. By way of example, construction projects involve a large number of stakeholders, e.g., manufacturers, main contractors and subcontractors, design staff, project and site managers. Moreover, construction sites are very dynamic operating environments where interactions among crews and equipment are affected by several external factors, such as adjacent buildings and facilities, traffic systems, complex weather phenomena, etc. Based on this, the construction process is an emergent property of a system whose components are subjected to non-linear and unexpected interactions that cannot always be anticipated [33]. This trend has been confirmed by [6], who formalized a model representing construction workflow variability.
Traditional project management approaches have proved to be efficient in stable and predictable conditions but fall short in facing complex scenarios [4]. Managing complexity requires both hierarchical and heterarchical principles simultaneously, to effectively adapt and navigate through uncertainty. Hence, what is required is a shift to a dynamic, adaptive, and participative bottom–up approach to management that can help to react rapidly and flexibly to changes in the environment [34]. The formalization of these requirements is provided by the holonic approach that combines both hierarchical and heterarchical approaches interchangeably, thus ensuring a combination of flexibility and control [4]. Holonic management systems, which represent the candidate strategy to tackle unexpected events, are based on the holonic theory introduced in 1967 by Koestler to explain the evolution of biological and social systems [35]. In his work, he tried to capture the behavior of complex systems by considering their constituent entities, i.e., holons, as being both wholes and parts at the same time. According to Koestler, a holonic system or holarchy is then a hierarchy of self-regulating holons that function (i) as autonomous wholes in supra-ordination to their parts, (ii) as dependent parts in subordination to control at higher levels, and (iii) in coordination with their local environment [35,36,37]. Therefore, holonic architecture combines elevated and predictable performance, which distinguishes hierarchical systems, with robustness against disturbances and the agility typical of heterarchical systems [38]. This guarantees the resilience of the overall system.
Japanese researchers were the first to apply Koestler’s holonic concept to the manufacturing area during the 1980s, in the design and implementation of a so-called holonic manipulator controller [39,40,41]. In the 1990s, a Holonic management system (HMS) architecture, called PROSA, was developed [8]. PROSA stands for the names of the composing types of holons: product, resource, order and staff. PROSA has been applied as a reference for several implementations in the manufacturing industry [8,42,43,44,45].
Moving to the AEC industry, [4] developed a theoretical framework illustrating the benefits of the holonic management approach based on three case studies of megaprojects in Australia and the US. In [46], a Holonic Construction Management (HCM) model was proposed to define a collaborative production network and tested by providing a low-level holarchy configuration for the rebar supply of an ongoing project. To the best of the authors’ knowledge, the only application of the PROSA reference architecture to the construction sector has been provided by [47], who proposed a holonic execution system for real-time management in the open-air engineering domain, namely for the execution of bored piles. Although relevant contributions have been provided by the previous study, several challenges still remain uncovered, such as on-site validation of a PROSA-based HMS and its integration with process models [48].
Further studies would contribute to the body of knowledge by carrying out on-site validations of similar HMSs based on PROSA.

1.3. Research Questions Covered by This Study

This study investigates the development of a process-based construction management system and the applicability of the holonic theory in the same domain. In particular, three research questions will be answered. The first research question (i.e., RQ1) asks whether a process-based approach can benefit from automatic construction planning, also considering the possibility of supporting continuous replanning during the course of ongoing work. The second research question (i.e., RQ2) concerns whether a spatial conflict simulator could detect spatial interferences eventually included within automatically generated work plans. The third research question (i.e., RQ3) investigates whether PROSA can be considered a general reference architecture for developing a holonic management system supporting the execution of construction projects. This question includes three technical sub-challenges: defining the configuration of a system architecture supporting the implementation of a holonic management system; mapping holons defined in PROSA to the actors involved in construction projects; and carrying out on-site tests to check the viability of such a holonic management system.
To answer such questions, we first defined the concept of a process-based construction planning system, and then, based on the logic that emerged from this step, we defined the system architecture of a holonic management system based on PROSA. Finally, the technical implementation and on-site tests are presented through a detailed description of the proposed replanning workflow.

2. Materials and Methods

2.1. The Concept Development

This study presents a holonic process-based construction management system that integrates two sub-systems. The first one is called the Automated Work Planning Service (AWOPS) and the other is called the Spatial Conflicts Simulator (SCS). Both were developed within the EU funded project ENCORE, standing for “ENergy aware BIM Cloud Platform in a COst-effective Building REnovation Context”. The main objective of ENCORE is to increase the share of renovated stock in Europe and worldwide by providing effective and affordable BIM tools that cover the whole renovation lifecycle (i.e., from data collection to project implementation, and commissioning/delivery). AWOPS supports not only the creation of the work plan in the programming phase of renovation but also the update of the work plan during the implementation phase, based on collected work progress data. A preliminary version of AWOPS was presented in [49]. SCS, on the other hand, supports the detection of possible spatial conflicts included within automatically generated work plans before being delivered to the construction site.
The concept of the proposed holonic process-based construction management system is presented by Figure 1. The same figure summarizes the workflow logic regulating the functioning of the proposed system and depicts how its two sub-system (i.e., AWOPS and SCS) interface with the construction site and the ENCORE engine. The latter, as represented by the yellow dashed box in Figure 1, stores and provides required information related to the masterplan, price list, and BIM model.
Actions supported by AWOPS are summarized within the blue dashed box in Figure 1. The first step in using AWOPS is the definition of deliverables and main applicable constraints. To this purpose, the list of components to be removed from or added to the building is computed from new and existing IFC files, retrieved from the BIM model. On this basis, a planner (e.g., project manager/engineer) is asked to cluster the aforementioned components and rearrange them within several groups of construction deliverables, meant as groups of building components, which are the object of activities performed by the same crew within the same workspace. In this phase, the user exploits their expertise to define the basic information while the work is being carried out. If a time limit provided by the masterplan is applicable to deliverables, the planner is allowed to associate the earliest and latest completion dates with such deliverables. Afterwards, construction processes are defined by the planner as sequences of tasks, representing abstract models of construction processes (Figure 1). Thanks to this approach, the knowledge of the user in charge of planning will be identified, captured, documented and shared in the form of best practices of construction applied to a renovation project. As described more in detail in the next subsection about processes definition, formalizing such construction knowledge into machine-readable process models (e.g., BPMN) contributes to defining inputs for automatic replanning algorithms. This step is crucial to answer RQ1. Each task of a process must be associated with that item of the price list which is applicable for the renovation work of the project. This association allows the planner to unambiguously describe the activity that must be performed; furthermore, the type and productivity of the involved crew are automatically attached, thanks to the link between the price list and the respective cost/resource analyses. In this way, technological information provided by the price lists contributes to fully defining process tasks and covers missing aspects in the BIM model. To this purpose, the planner associates every construction deliverable with one process. It is noteworthy that one process can be associated with several deliverables and that the planner can select and edit processes already developed and available in a library containing previously defined processes. The association between deliverables and processes provides the information required to instantiate activities (Figure 1). In fact, activities are instantiated by replicating each task of a process as many times as the number of associations of the process to deliverables. Crews, instead, are defined for each process according to resource analysis provided by price lists (Figure 1). The resulting lists of activities and crews constitute the input of the planning algorithm, which is in charge of generating the work plan. The latter, being the result of the first planning action (i.e., “phase no. 1” in Figure 1), can be defined as the first work plan. In this study, a stigmergic algorithm, developed as an extension of the multiple ant colony system for vehicle routing problems with time windows (MACS-VRPTW), is adopted [50,51]. Research in manufacturing found that, for several reasons, stigmergy is a candidate approach to simulate the possible future development of systems made of agents. Above all, because such algorithms can provide a near-optimal solution in a finite time, the longer the time available for computing, the more accurate the solution.
In order to be approved and delivered to the construction site, the general work plan must be spatially simulated to check if it includes any spatial interferences among crews. As such, the work plan, along with the BIM model, must be provided as inputs to SCS. The logic regulating the application of SCS is described within the orange dashed box in Figure 1. Detected spatial interferences will be dealt with by crews leaders with the aim of resolving them by low-level agreements. Only if no low-level agreement can be found will a high-level intervention on the part of the planner (e.g., project manager/engineer) be required to resolve detected interferences by updating processes logic and/or temporal constraints relating to activity. In this second scenario, the work plan will be updated until no relevant spatial interference remains unresolved. This feature makes the overall workflow holonic. In fact, resources (i.e., the planner and crew leaders) are required to cooperate in the event that a conflict is detected; should the system not detect any conflicts or if they can be resolved at a low level, high-level decisions are not required, and the process continues. This logic, which is described in detail in the next subsection regarding the spatial simulation of the work plan, contributes to answering RQ2. Once all interferences have been resolved, the resulting work plan will be approved by the planner (Figure 1).
The approved work plan is delivered to the construction site to be adopted for implementation in the construction work. Figure 1 reports a green dashed box indicating the construction site domain. Here, a supervisor (e.g., field manager/engineer) monitors the project execution and tracks the work progress data. Based on this data, the work plan is updated during the following replanning phase, e.g., phase no. i (Figure 1).
To sum up, the proposed holonic process-based construction management system differs from traditional ones in at least three key features due to the integration of the holonic- and process-based paradigms. The process-based paradigm (i) enables formalizing construction knowledge into machine-readable process models and defining inputs for automatic replanning. Process models can be stored into libraries and reused in the same or different construction projects, avoiding the burden of redefining them from scratch. In addition, automated generated workplans, before being delivered to the construction site, are (ii) spatially checked in order to detect eventual spatial issues. Finally, the holonic-based approach (iii) prioritizes issue resolution at a low level among crew leaders (i.e., low-level decisions), asking for the project manager’s intervention at a high level (i.e., high-level decision) only if necessary.
In the following subsections, the holonic and technical features of the proposed system are fully outlined.

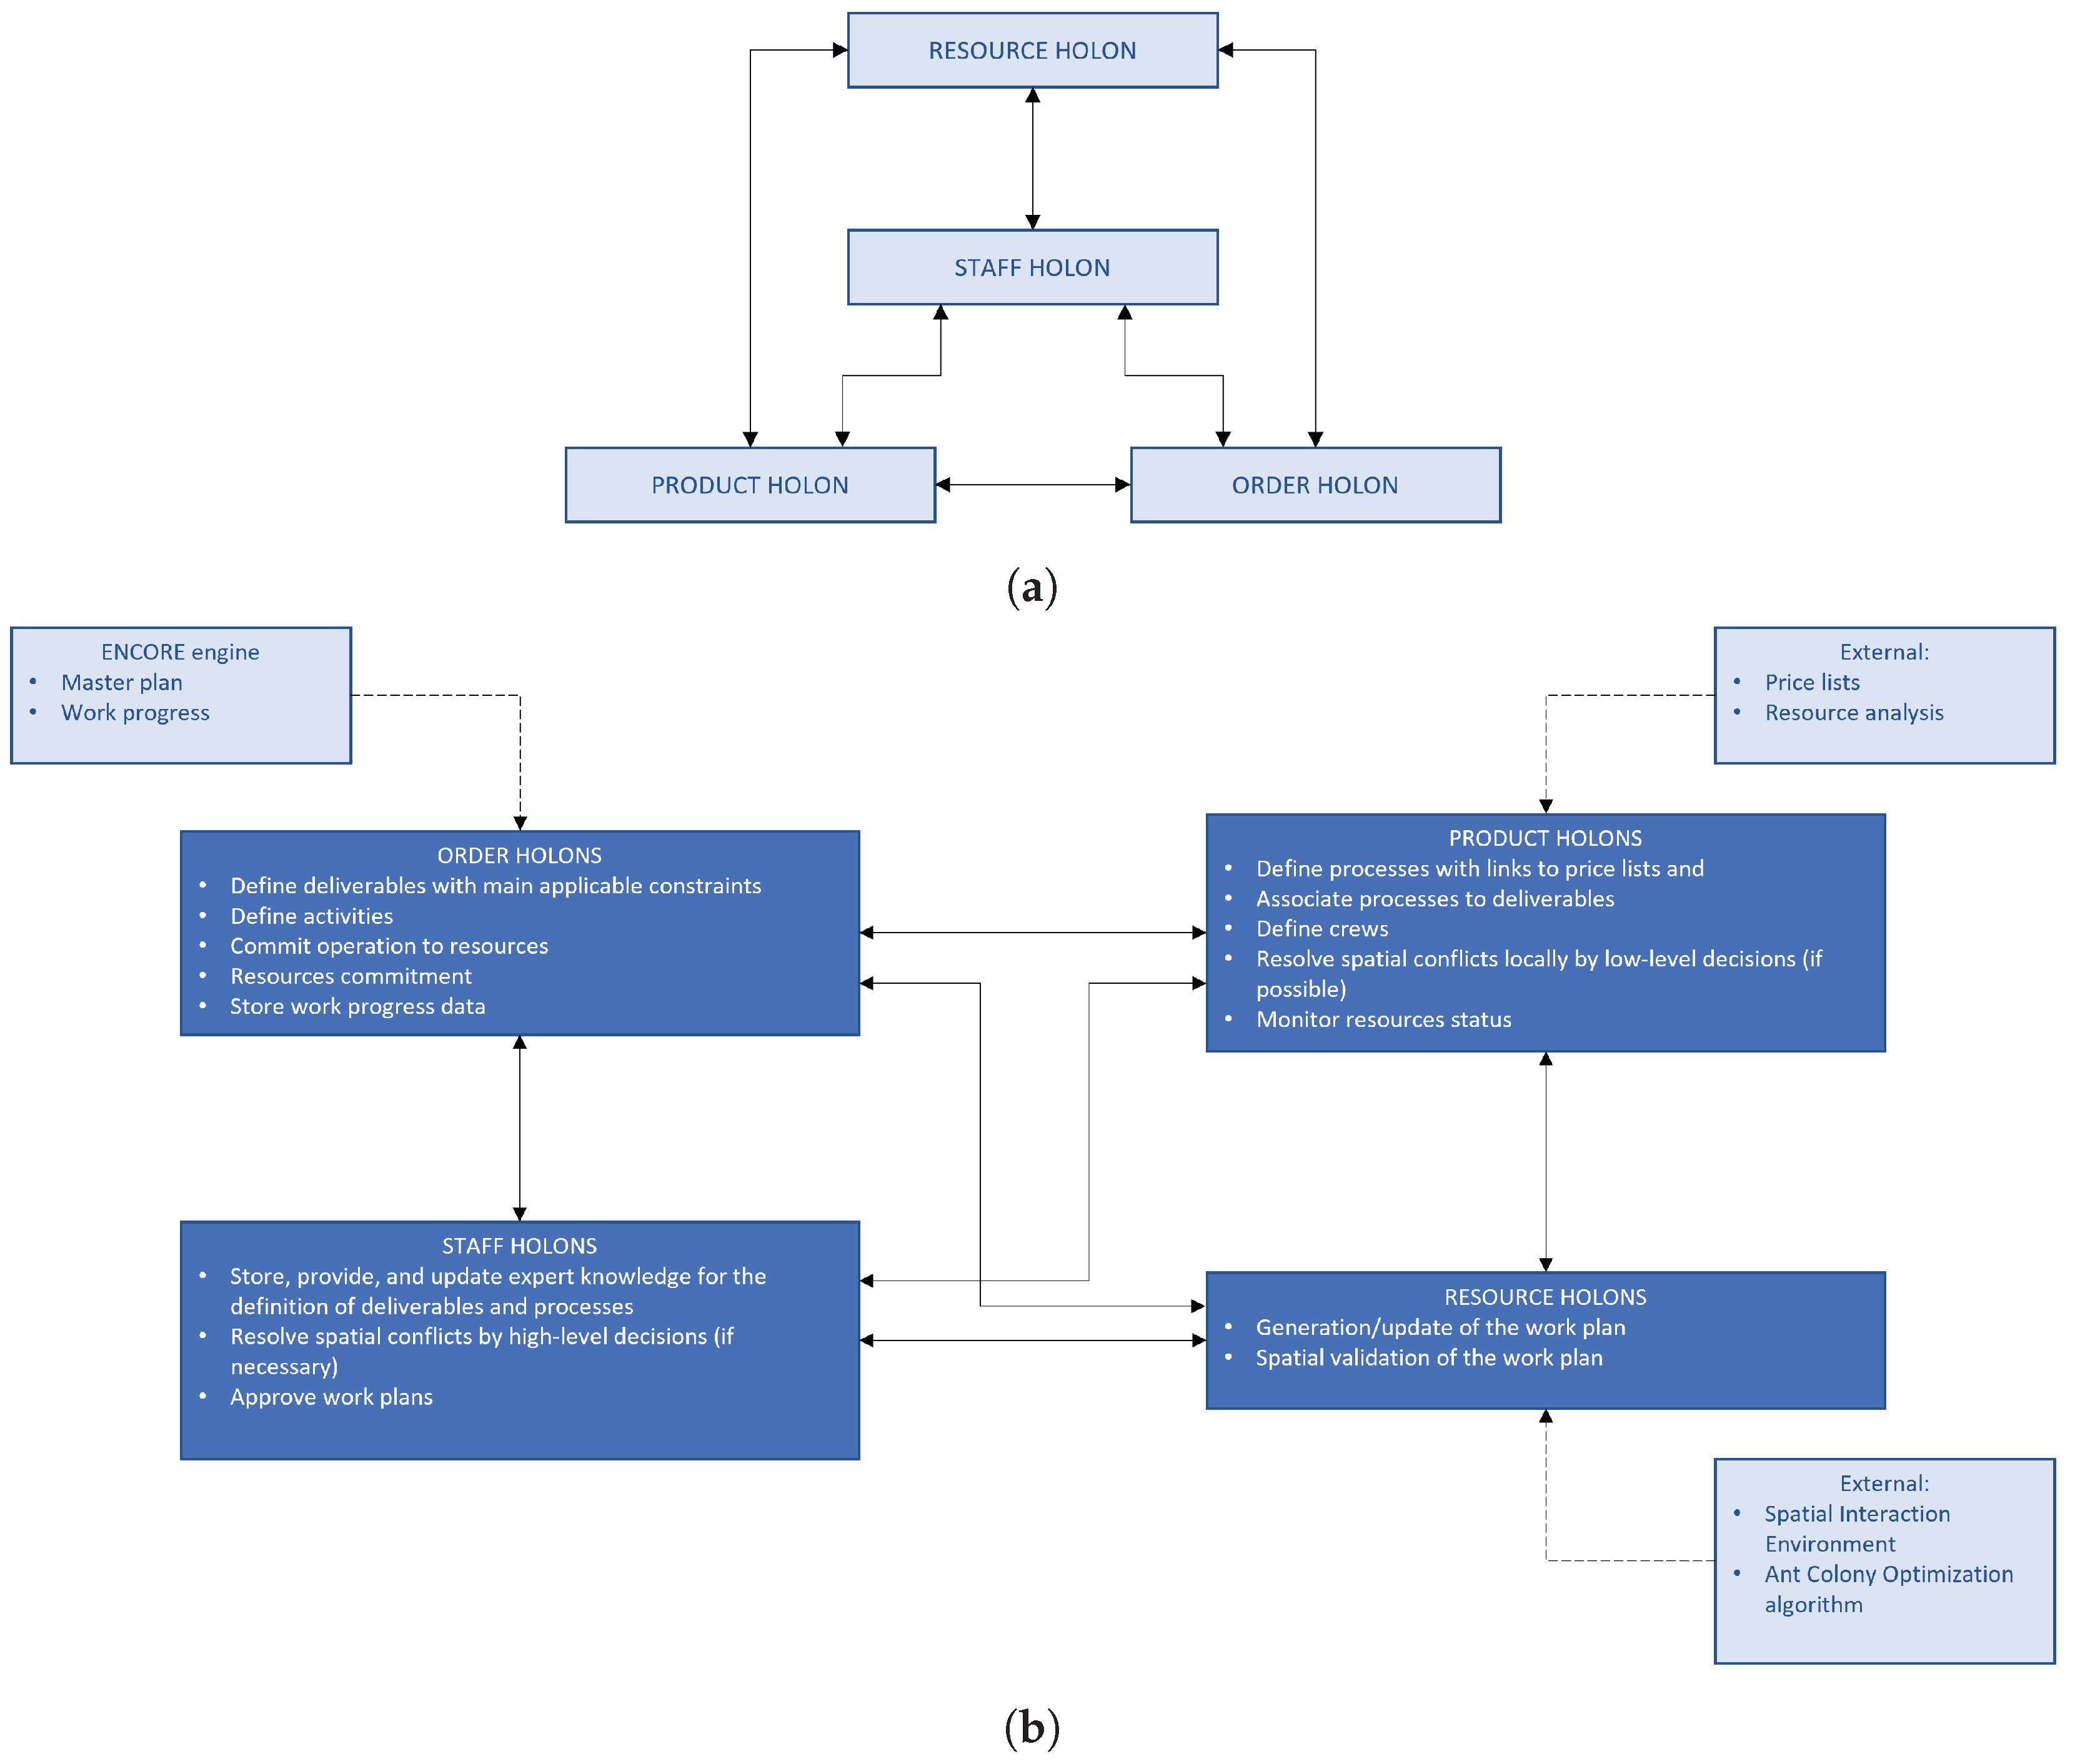
2.2. The Holonic Management of Construction Projects

The dynamics of a construction site can be studied as an emergent property of interactions between individual crew members on the site and the environment. The required system architecture must be proactive, partially automated, favoring human–machine collaboration, and it must not suffer from excessive computational loads or communication breakdowns. To fulfill these requirements and answer RQ3, a holonic system architecture based on PROSA was developed and tested in a real renovation project. Figure 2 depicts a mapping between PROSA architecture and the holarchy of the proposed holonic process-based construction management system.
PROSA is adopted as a reference architecture, as it was successfully applied in the manufacturing industry to set up adaptable and highly flexible management systems, still providing a clear and effective decision-making process. The four basic types of holons adopted in PROSA (i.e., product, resource, order, and staff holons) (Figure 2a) [36] are mapped to actors involved in the construction process, contributing to answering RQ3. To this purpose and with the aim of defining the system architecture of the proposed holonic process-based construction management system, the roles covered by the four types of holons defined in PROSA are summarized in Figure 2b. In detail, Figure 2b depicts the PROSA-based holarchy of the proposed system mapped on the general PROSA architecture reported in Figure 2a. Figure 3, on the other hand, depicts the resulting system architecture made up of four units: deliverables and processes, planning, simulations, and high-level decisions and low-level decisions. The same figure clearly depicts the main features that make the proposed system different from traditional ones. In fact, the high-level decisions and low-level decisions units are in charge for prioritizing issues resolution at a low level, asking for high-level intervention only if necessary. The deliverables and processes unit, instead, enables formalizing construction knowledge into machine-readable process models and defining inputs for automatic replanning by the process unit. Finally, the simulation unit spatially checks automated generated work plans in order to detected eventual spatial conflicts.
Staff holons, represented by human actors (e.g., project manager/engineer), support the creation of product and order holons by providing expert knowledge in the definition of construction methods and in the formation of construction deliverables (Figure 2b). More in detail, creating order holons means creating deliverable groups. Instead, creating product holons means building construction methods, associating construction methods with deliverable groups, and identifying resources (e.g., crews and equipment) according to price lists. Order holons, based on information retrieved from product holons, can at this point define activities. This role of staff holons instantiating product and order holons is assigned to the deliverables and processes unit. In fact, as reported in Figure 3, this unit includes web-service applications that cover several functions, such as the definition of deliverables and BPMN processes. BPMN processes can be defined from scratch or by editing those already defined and stored in a library. At this step, the deliverables and processes unit also supports navigating price lists and links them to process tasks by dedicated web-service applications. Finally, the deliverables and processes unit also covers the association of BPMN processes to deliverables and the retrieval of crews and activities (Figure 3). At this point, product holons provide resource holons with technological aspects to correctly process an order (e.g., the necessary process parameters to perform an operation). Resource holons call delegates (i.e., delegate MAS formalized as Ant Colony Optimization algorithm) to generate a feasible workplan as the results of virtually executed operations (Figure 2b). The feasible workplan that minimizes the adopted cost function is a sub-optimal solution, representing the candidate workplan. In addition, resource holons call other delegates (i.e., agents within the SCS) to simulate the spatial movement of resources in the short term (i.e., two working days ahead) (Figure 2b). Tasks covered so far by resource holons are assigned to two different units in the system: the planning and the simulation units (Figure 3). In fact, the first one, interfaced with the deliverables and process unit, includes web-service applications for invoking the stigmergic algorithm that generates work plans through an API. The second one, on the other hand, which is interfaced with the planning one for retrieving the generated work plan and developed within a serious gaming environment, offers the possibility to load the retrieved work plans (i.e., JSON file format) and BIM models (i.e., glTF file format). The latter are provided by the ENCORE engine through a REST API. In addition, this serious gaming application can generate workspaces and check whether any spatial conflicts occur within a predetermined time slot. The default value is set at two days ahead. Possible spatial conflicts are provided to product holons who hold knowledge about construction methods to try to solve them locally, at a low level, by agreeing on a space trade-off (Figure 2b). This duty, as reported in Figure 3, is transferred to the low-level decision unit, interfaced to the simulation one and populated by crew leaders. Practically speaking, this means that the latter always try first to solve spatial interferences based on the information available locally. Otherwise, if product holons are not able to fulfill this task, staff holons are asked to intervene at a higher level by adding process constraints or postponing activities (Figure 2b). The high-level decisions unit, interfaced with both the planning and simulations ones in Figure 3, is specifically defined to cover similar scenarios in which the planner has to find a strategy to solve spatial interferences and approve the work plan, in case no more spatial interference exists. Also, the final approval of the work plan is the responsibility of staff holons. Once all interferences have been resolved and staff holons have given their approval, the resulting work plan is provided to order holons. The latter query their corresponding product holons on how to correctly execute tasks by adopting certain resources and then committing operations to resources (Figure 2b). In practical terms, crews and equipment required for the execution of construction works can be hired based on resource types retrieved by the deliverables and processes unit (Figure 3). While work is being carried out, order holons keep track of the tasks being performed, and the resource status is monitored by product holons (Figure 2b). In the proposed system architecture (Figure 3), the planning unit includes a web service for inputting work progress data and monitoring resources status. Before subsequent replanning, staff holons apply updated knowledge about construction processes and external constraints (Figure 2b). As described at the beginning of this section, the deliverables and processes unit covers this part of the replanning process.

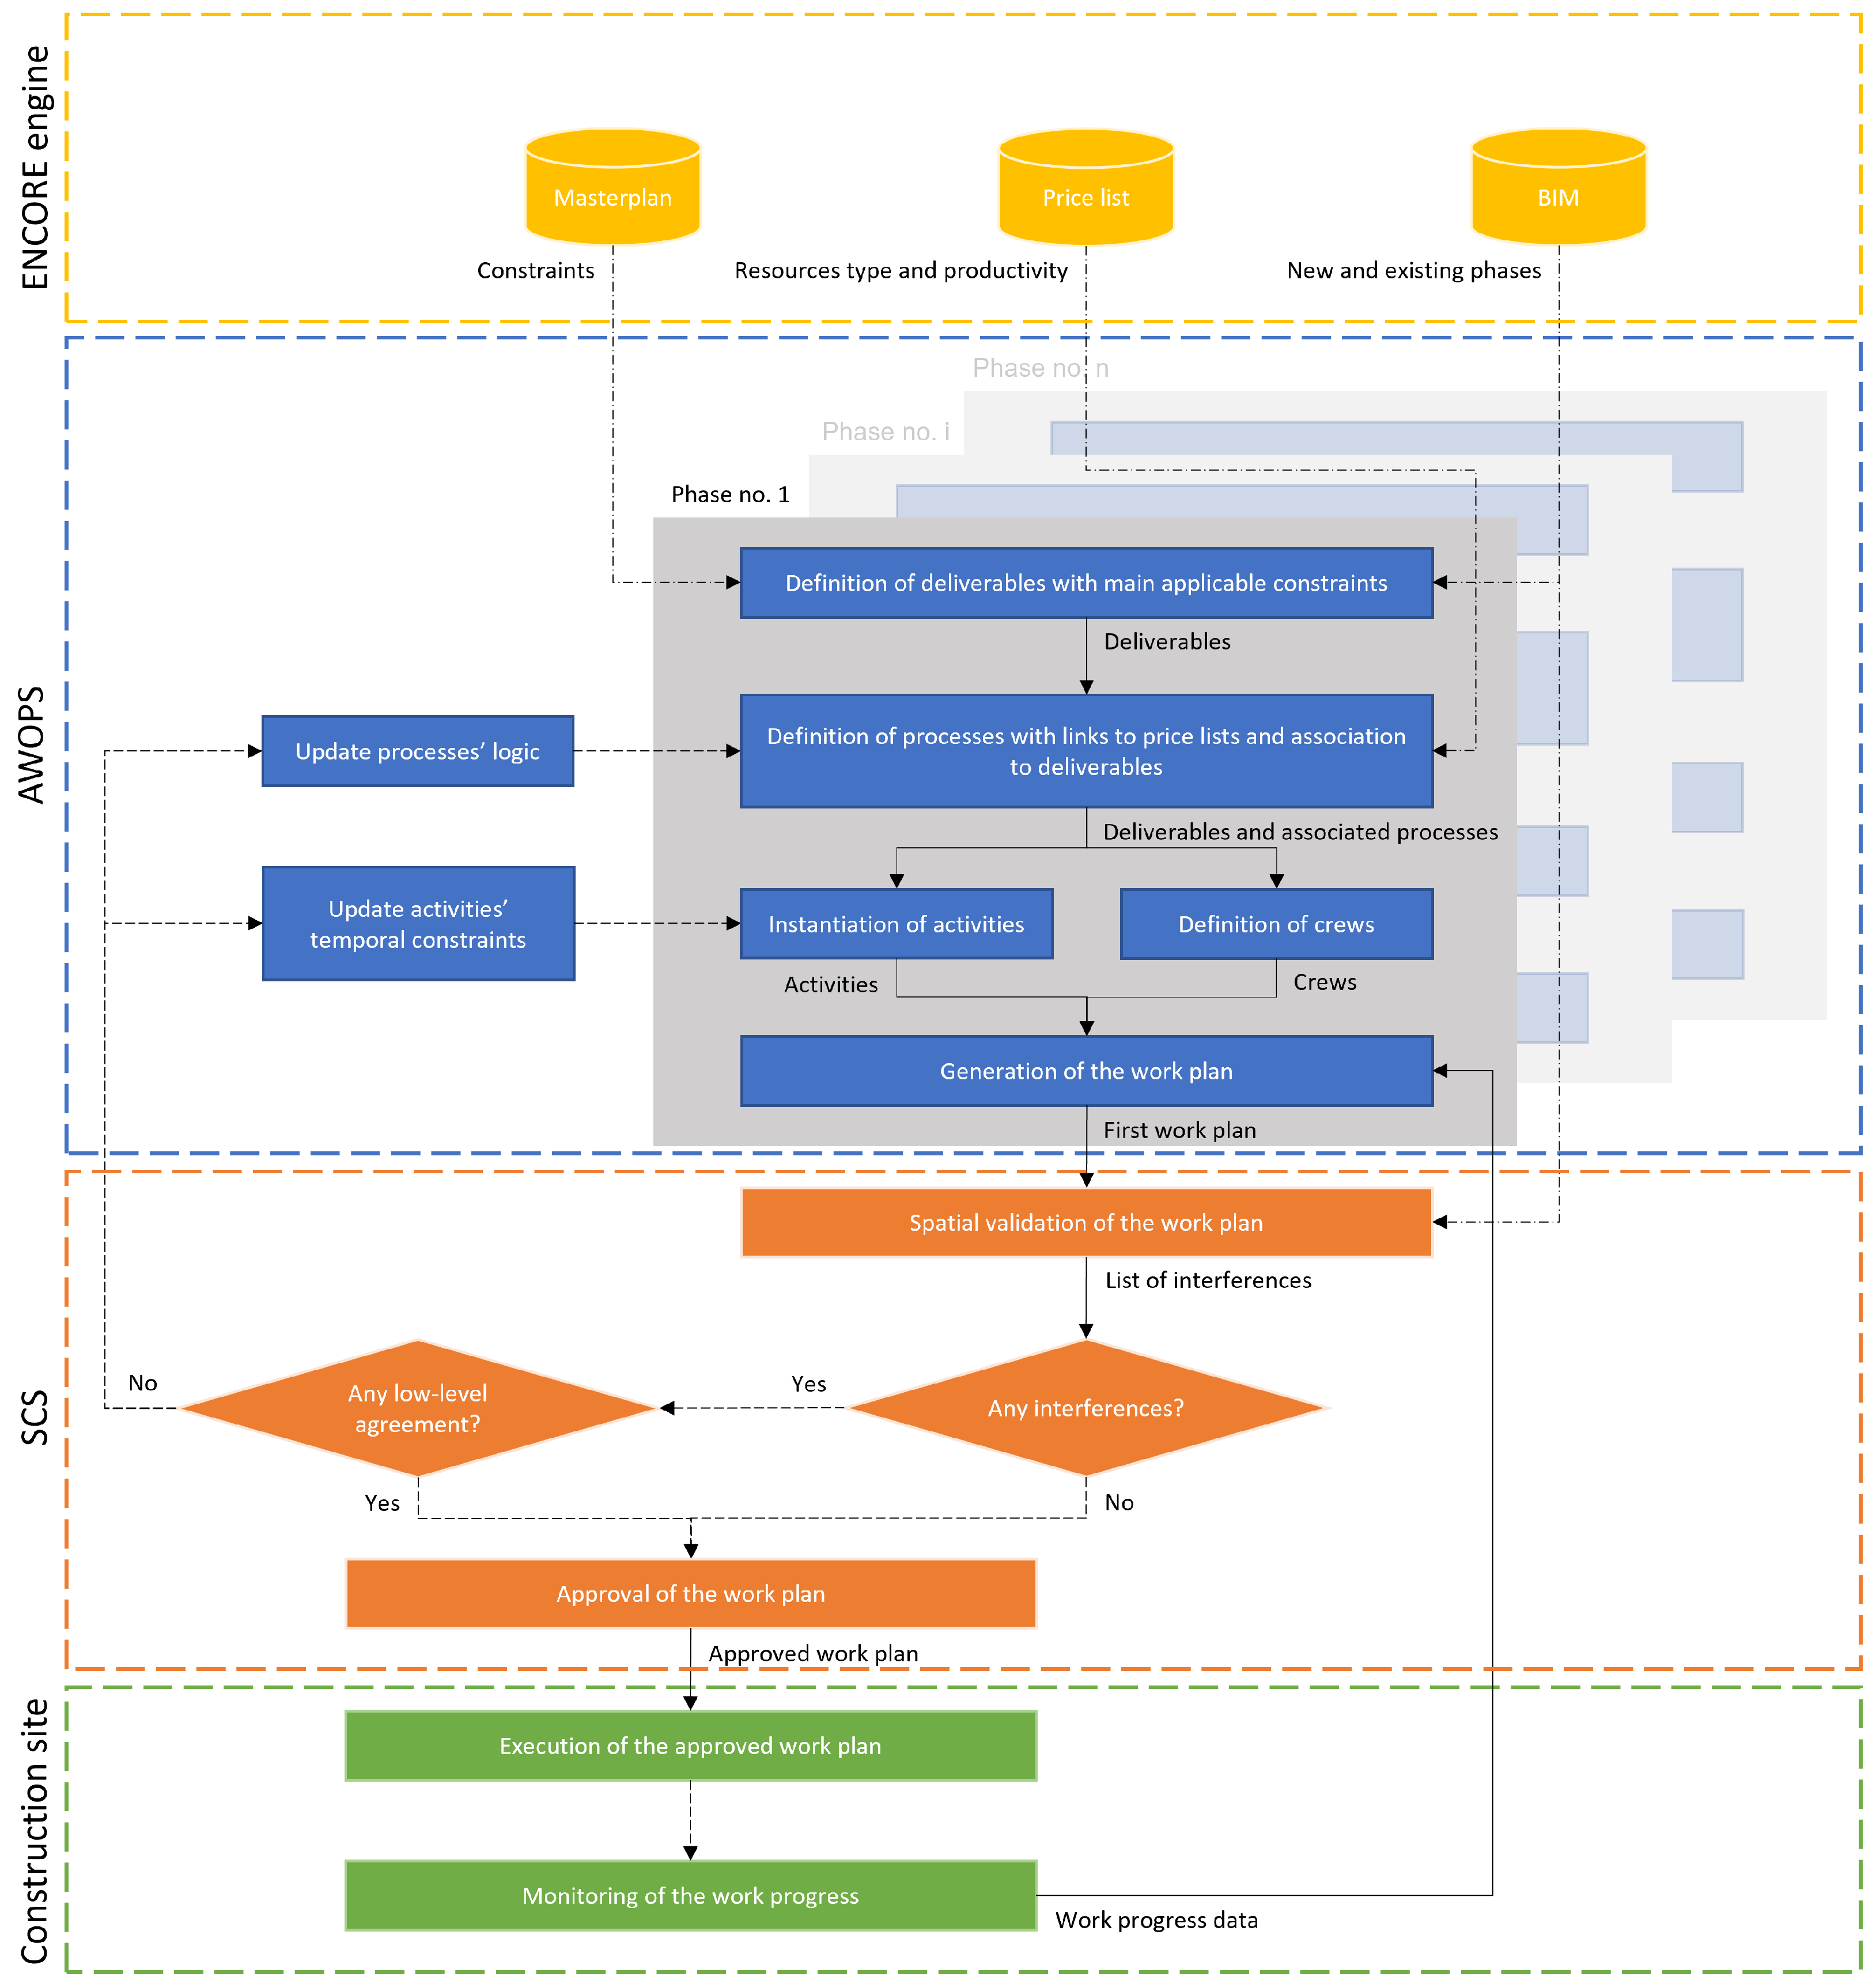
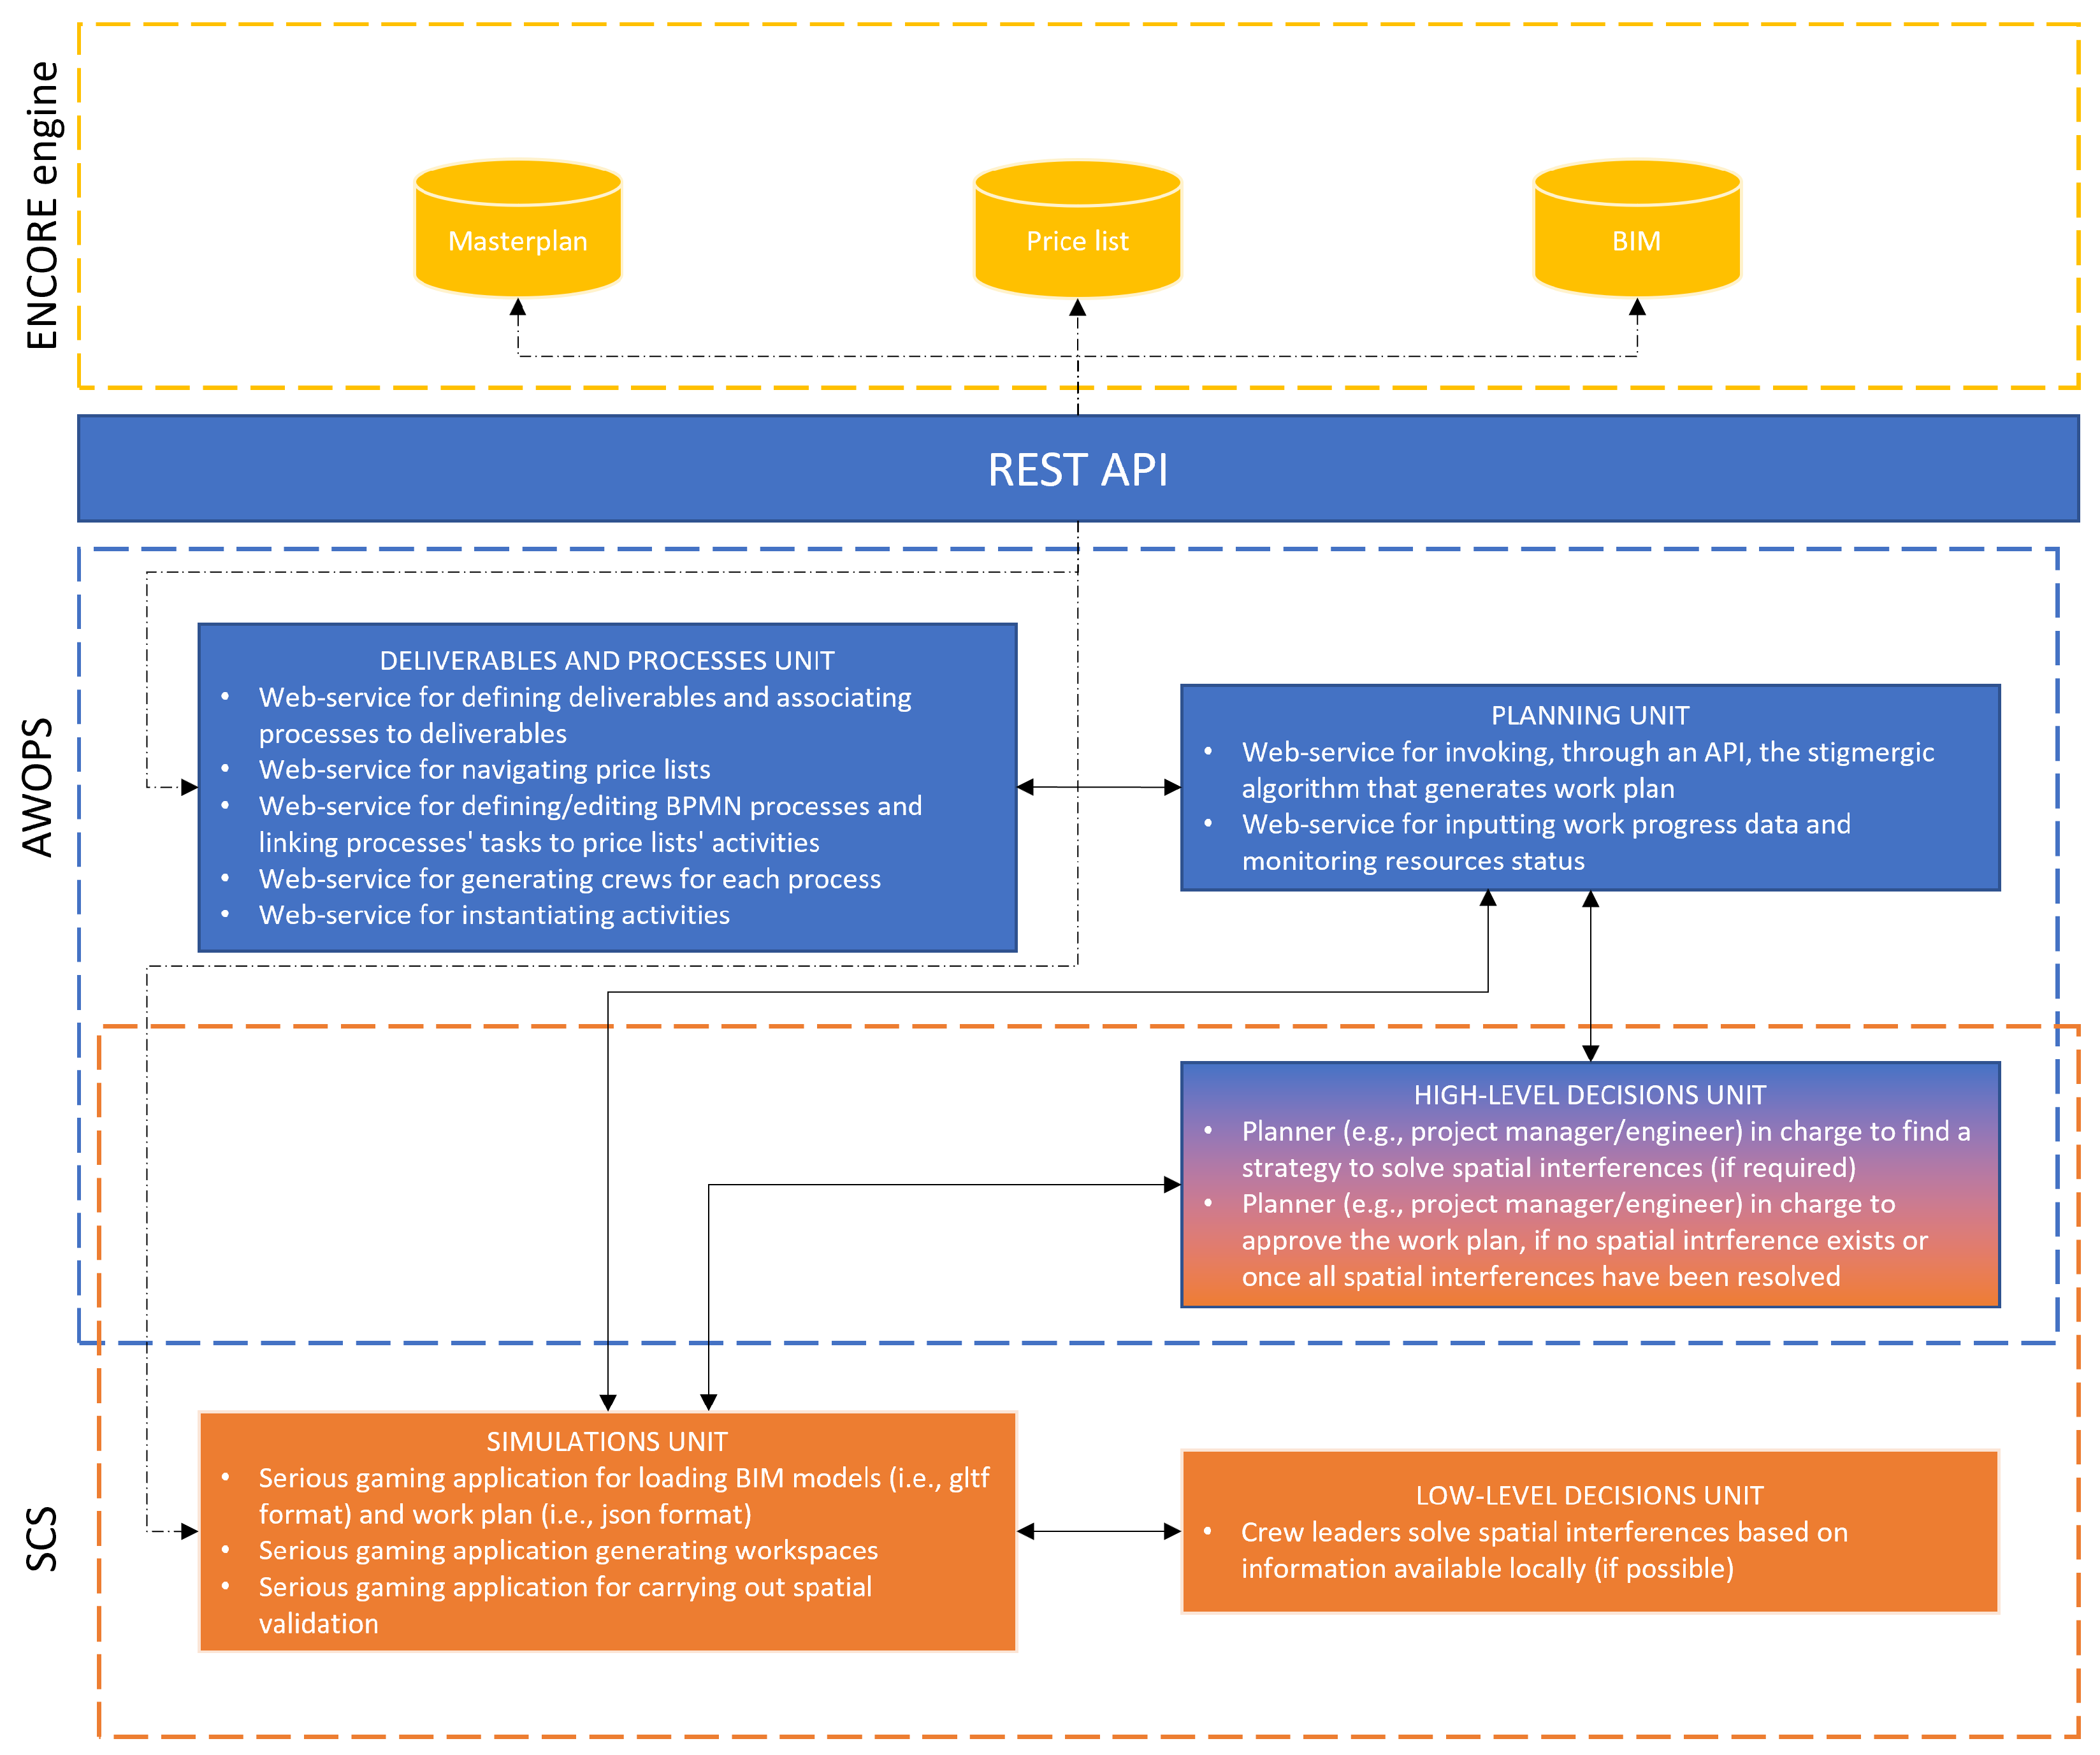
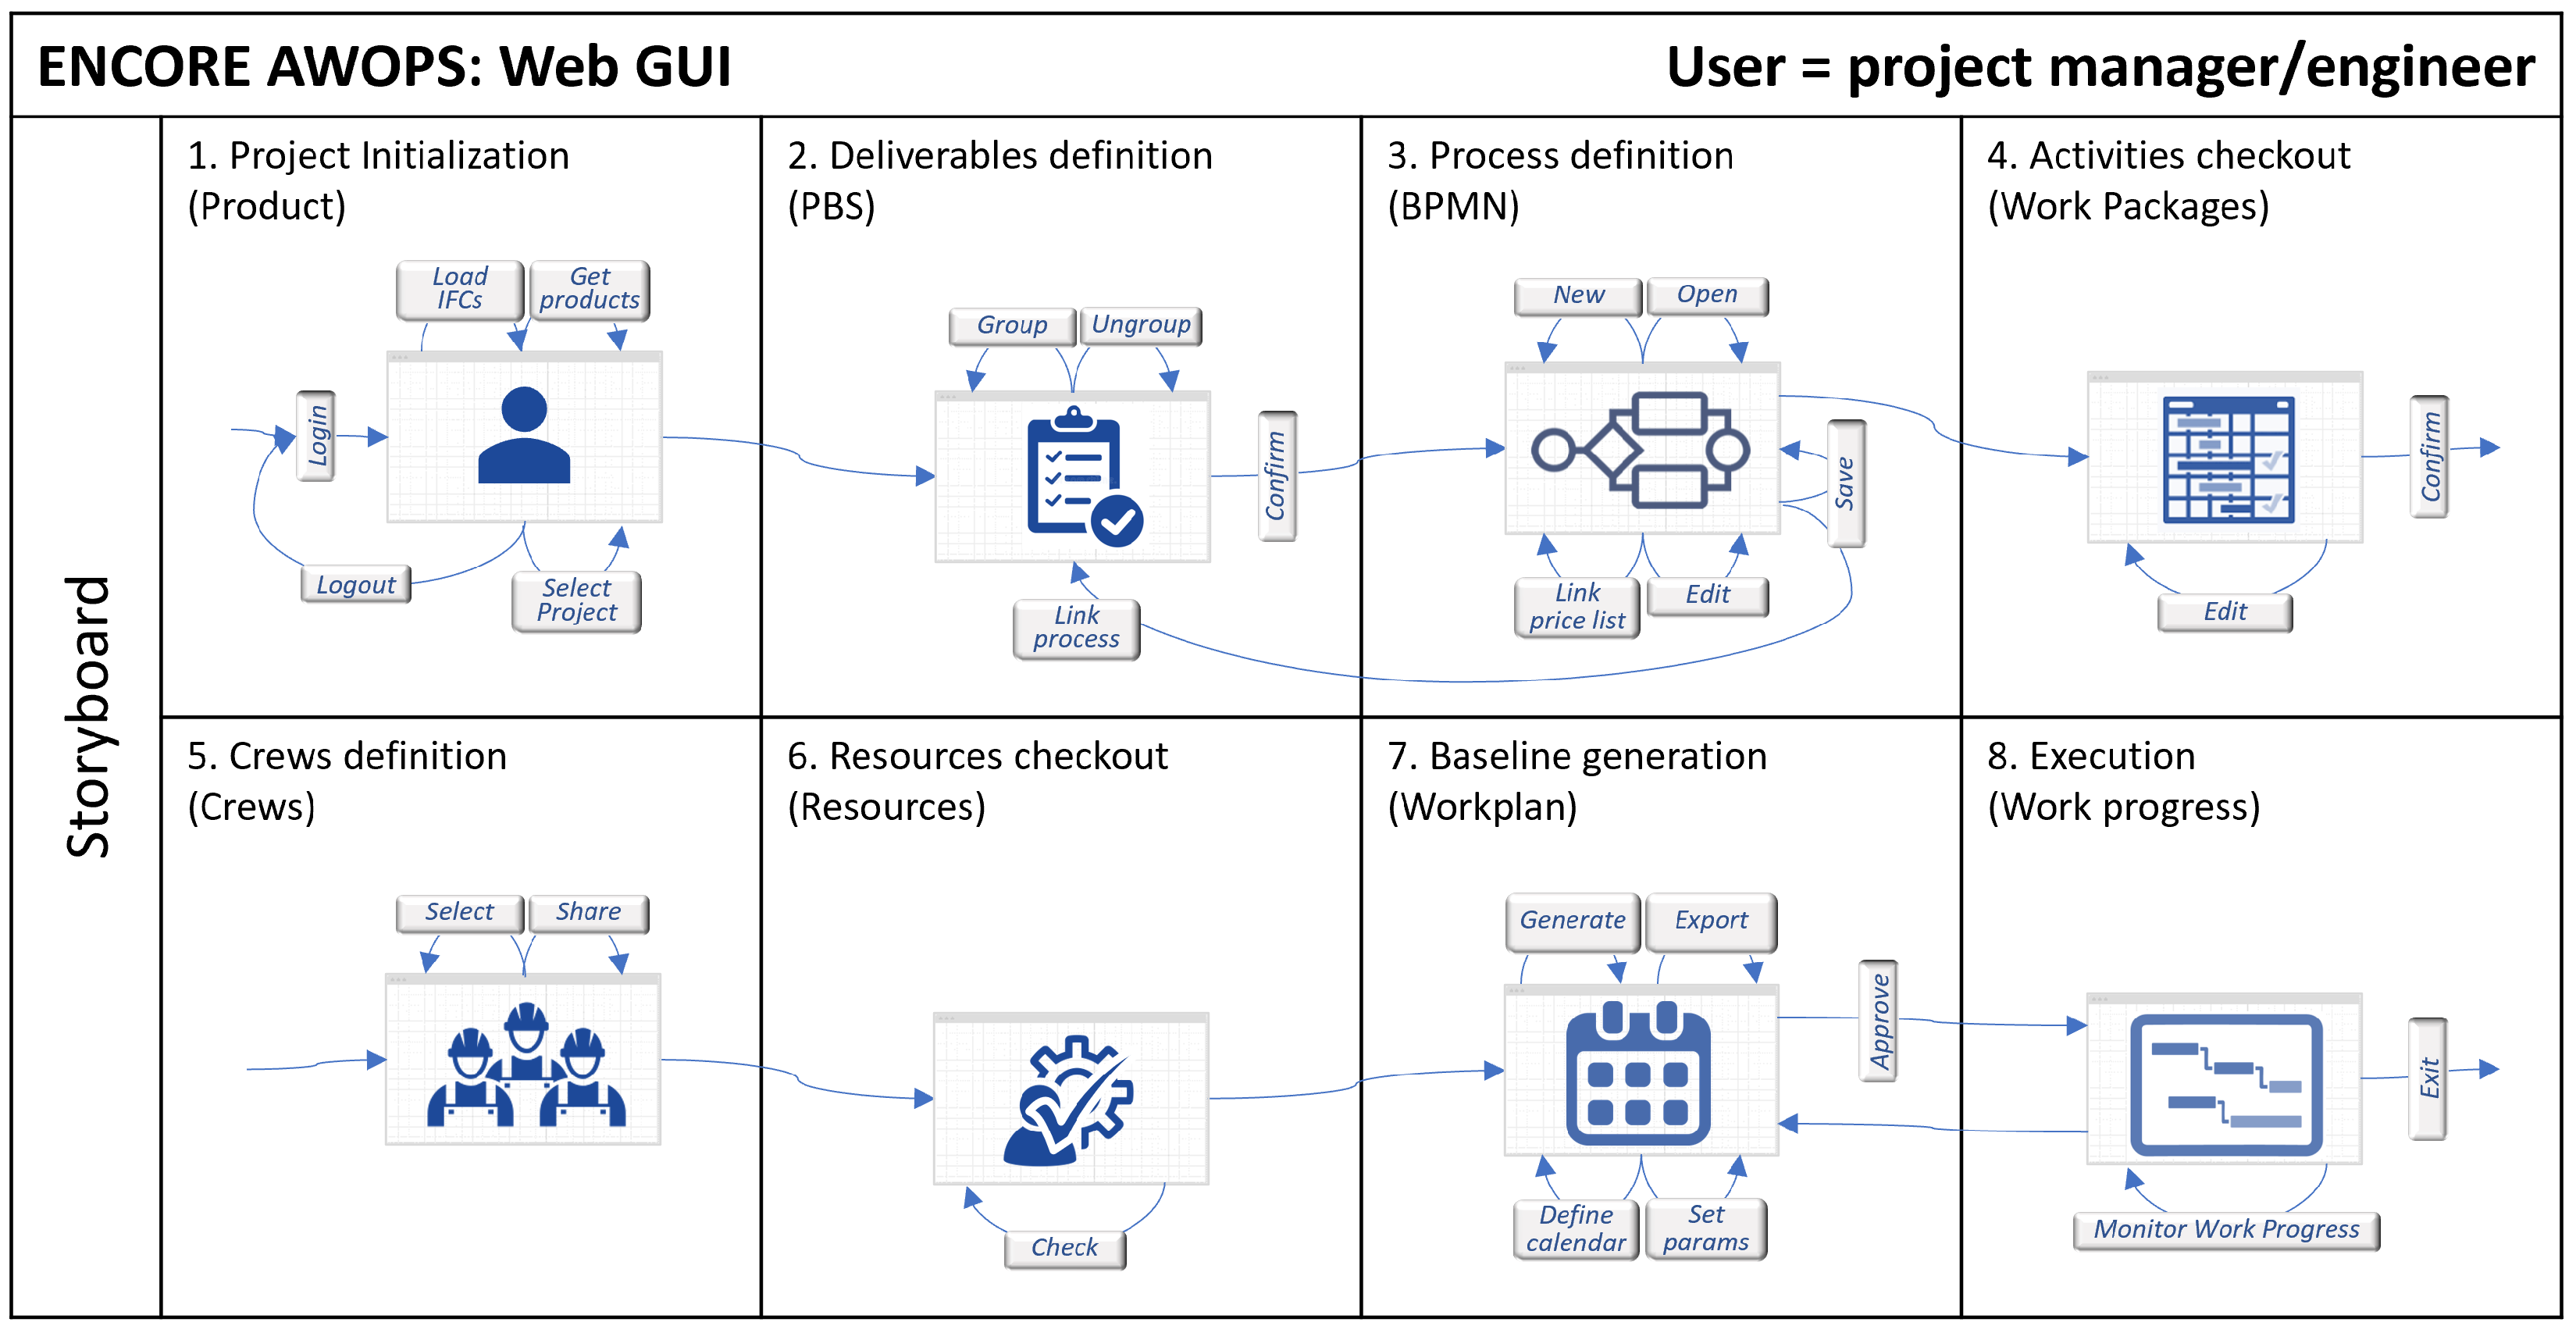
2.3. The Proposed Replanning Workflow: Technical Implementation

In this section, the technical implementation of the proposed holonic process-based construction management system is presented through the related replanning workflow based on AWOPS and SCS. The overall AWOPS technology is made up of a Web GUI, shown by Figure 4, which integrates several services to drive planners across the planning processes in the programming and implementation phases of renovation work. Figure 5 depicts the workflow describing the use of AWOPS. This workflow includes the following phases: project initialization, deliverables definition, processes definition, activities checkout, crew definition, resources checkout, baseline generation, and execution. It must be noted that these phases correspond, in the same order, respectively, to the web pages on the top right of the Web GUI: setup, deliverables, processes, activities, crews, resources, workplan, and execution (Figure 4a). SCS integrates the workflow described by the aforementioned phase at the level of the baseline generation. In fact, the resulting workplan, which is automatically generated by AWOPS, is passed, along with the BIM model, to SCS for spatial simulations.

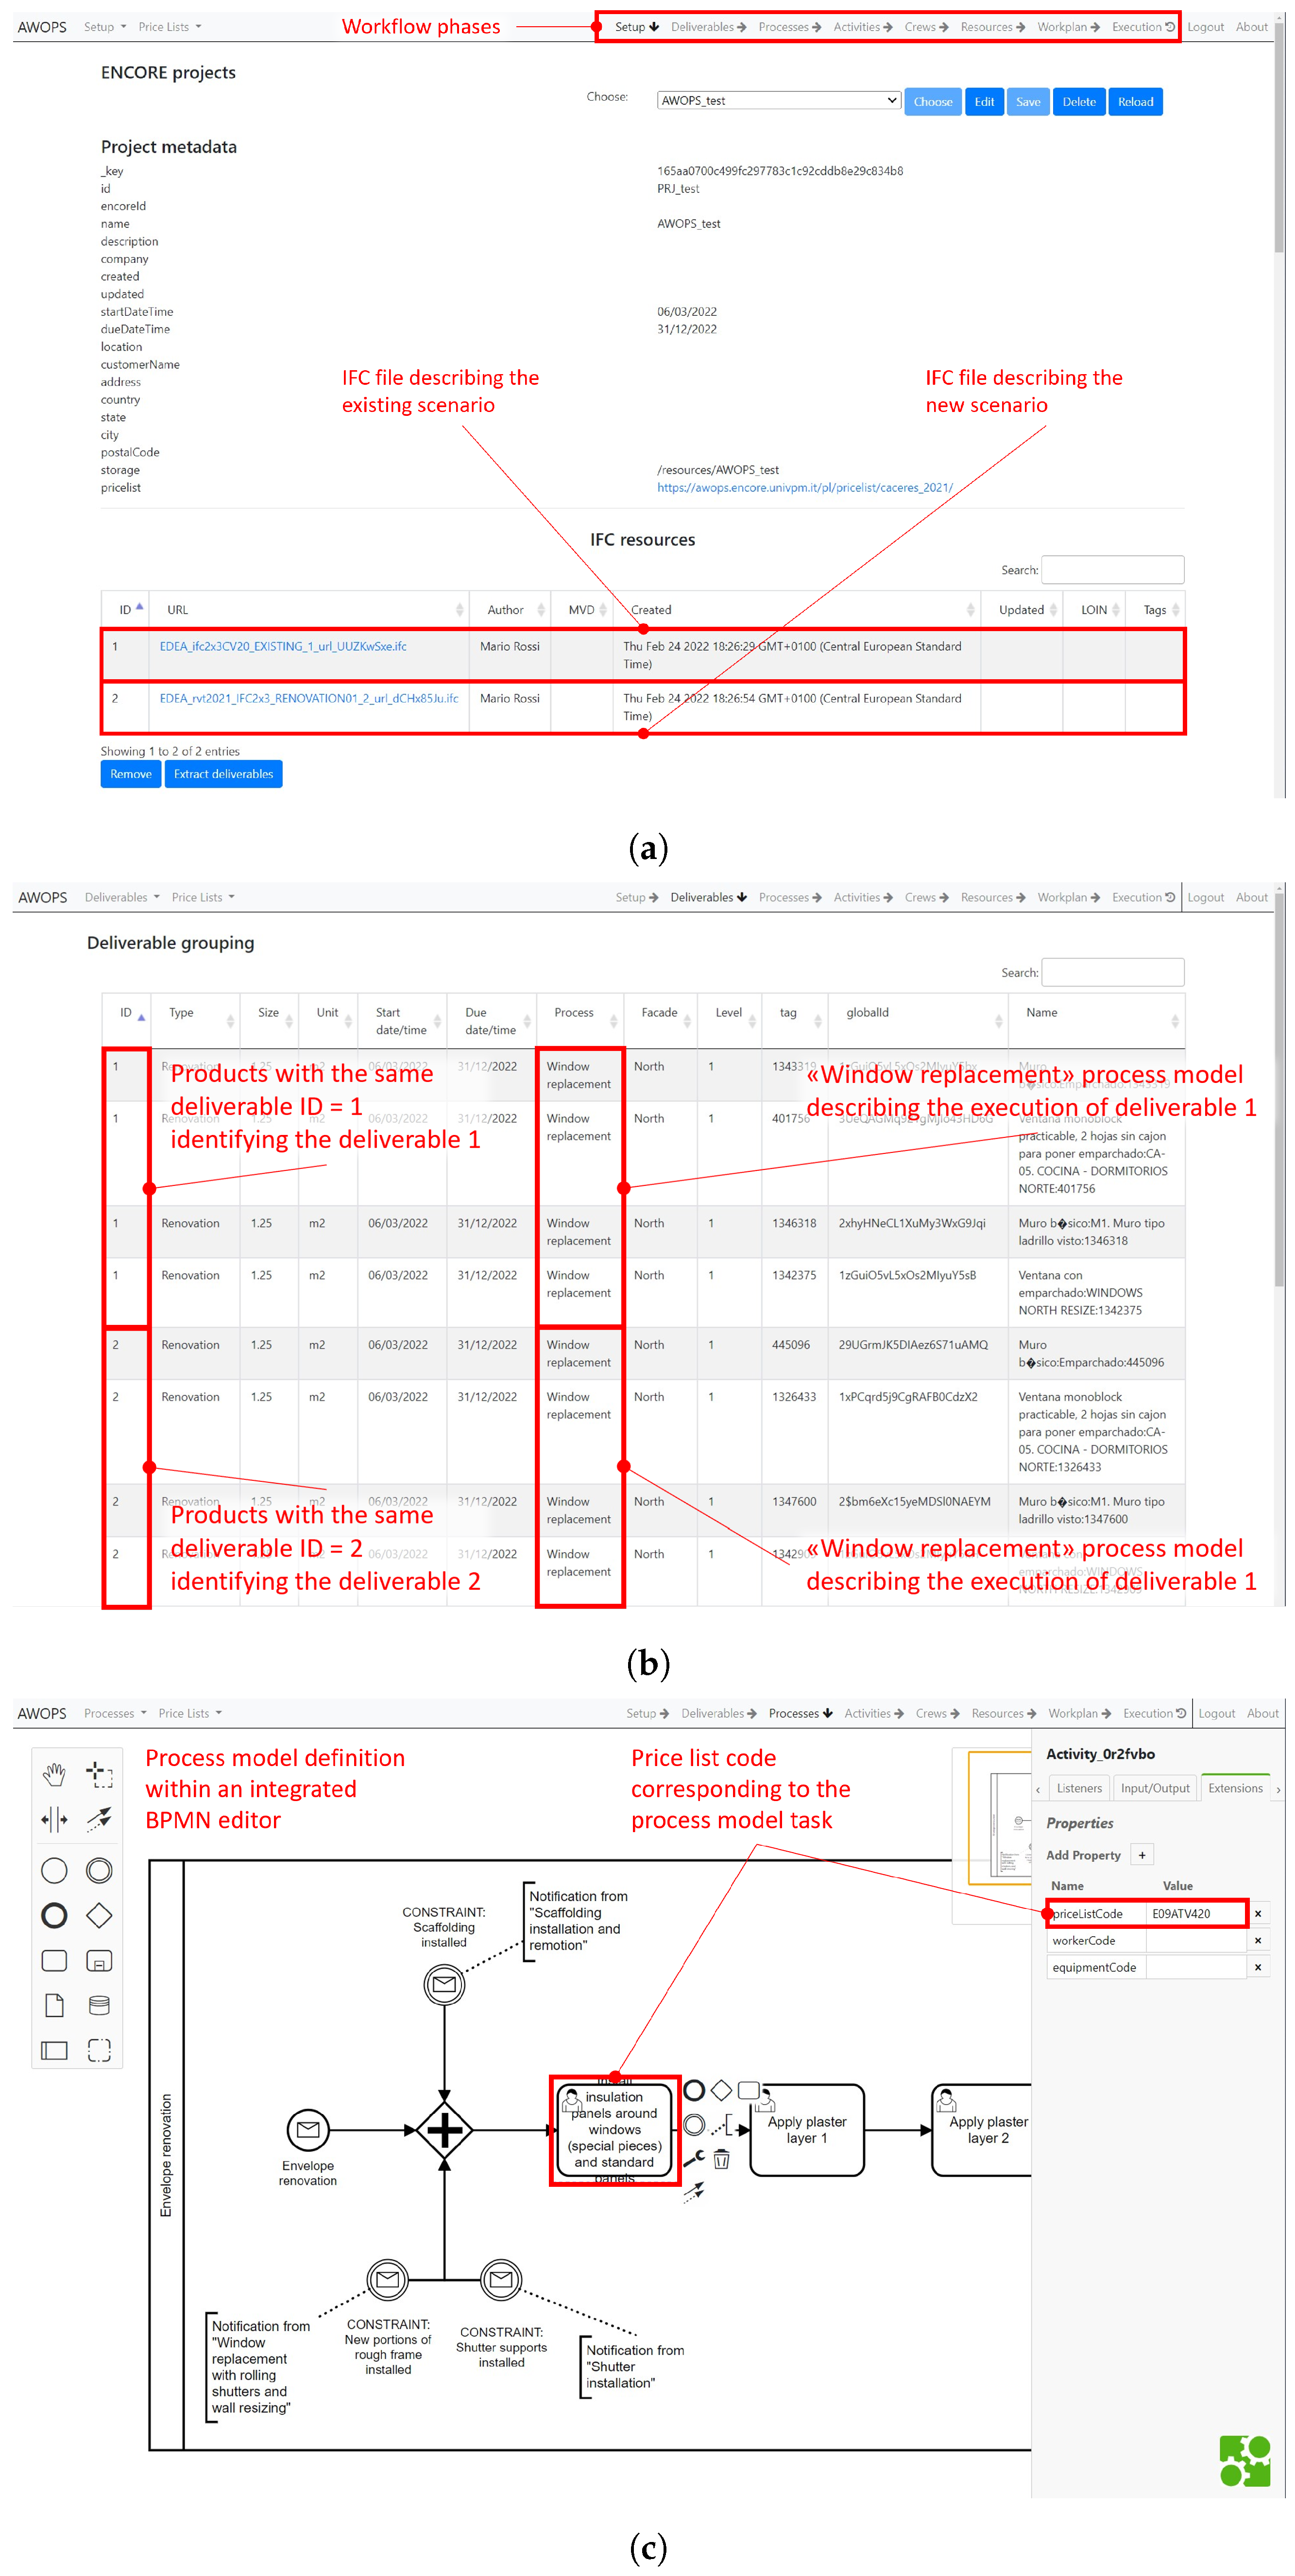
2.3.1. Project Initialization and Deliverables Definition

The replanning workflow starts with project initialization (Figure 5). The user (i.e., project manager/engineer) uploads at least two IFC files into the project: one file describing the existing scenario, and another file describing the final outcome as devised by the appointed study (Figure 4a). Afterwards, the user can generate a CSV file containing the list of new products added by the appointed study as well as a list of products to be demolished. This CSV file can be produced by comparing the existing and new IFC file, using existing state-of-the-art tools, such as the IfcOpenShell BIMserver library adopted in this study [52].
The second phase of the replanning workflow is the deliverables definition (Figure 5). Starting from the list of products to be demolished and/or built as generated in the previous step, the user defines construction deliverables, which are the output of this phase (Figure 4b). At this point, the user categorizes them into groups named “deliverables” by assigning the same deliverable ID: a deliverable contains one or more products to be used in the same workspace (e.g., a specific window with its frame) by the same type of crew. The last step, which can only be executed after the next phase, that is, processes definition, consists of linking the process corresponding to each deliverable (Figure 4b). The resulting list of deliverables makes up the so-called flat PBS. In this phase, the user exploits their expertise to define the basic information regarding the work phase.

2.3.2. Processes Definition

In the third phase, namely processes definition, the Web GUI supports users in several steps (Figure 5). The first step concerns the generation or editing of those processes that describe how the works will be managed operationally and links processes to the interested deliverables. This first step is enabled by a web service built on top of a BPMN editor. Business Process Modeling and Notation (BPMN) is adopted to define machine-readable process models describing the logic of activities and transformation processes. The graphical representation of BPMN makes models easy for stakeholders to understand, and the formal specifications in XML allow users to transform process models into simulation models automatically and with no ambiguity. BPMN process models may be reused as sub-process templates for future renovation projects, thus speeding up the next modeling effort. Thanks to this approach, the knowledge of the user in charge of planning is identified, captured, documented and shared in the form of best practices of construction applied to a renovation project. In the second step, the user is asked to pick out the items of the applicable price list, which best define the technology and operational approach to be followed for every activity included in the aforementioned processes (Figure 4c). The third step is automatic (i.e., performed by AWOPS) and regards the association of the type of resources in charge of every activity, derived from the association between the selected price list and the corresponding cost/resource analyses.

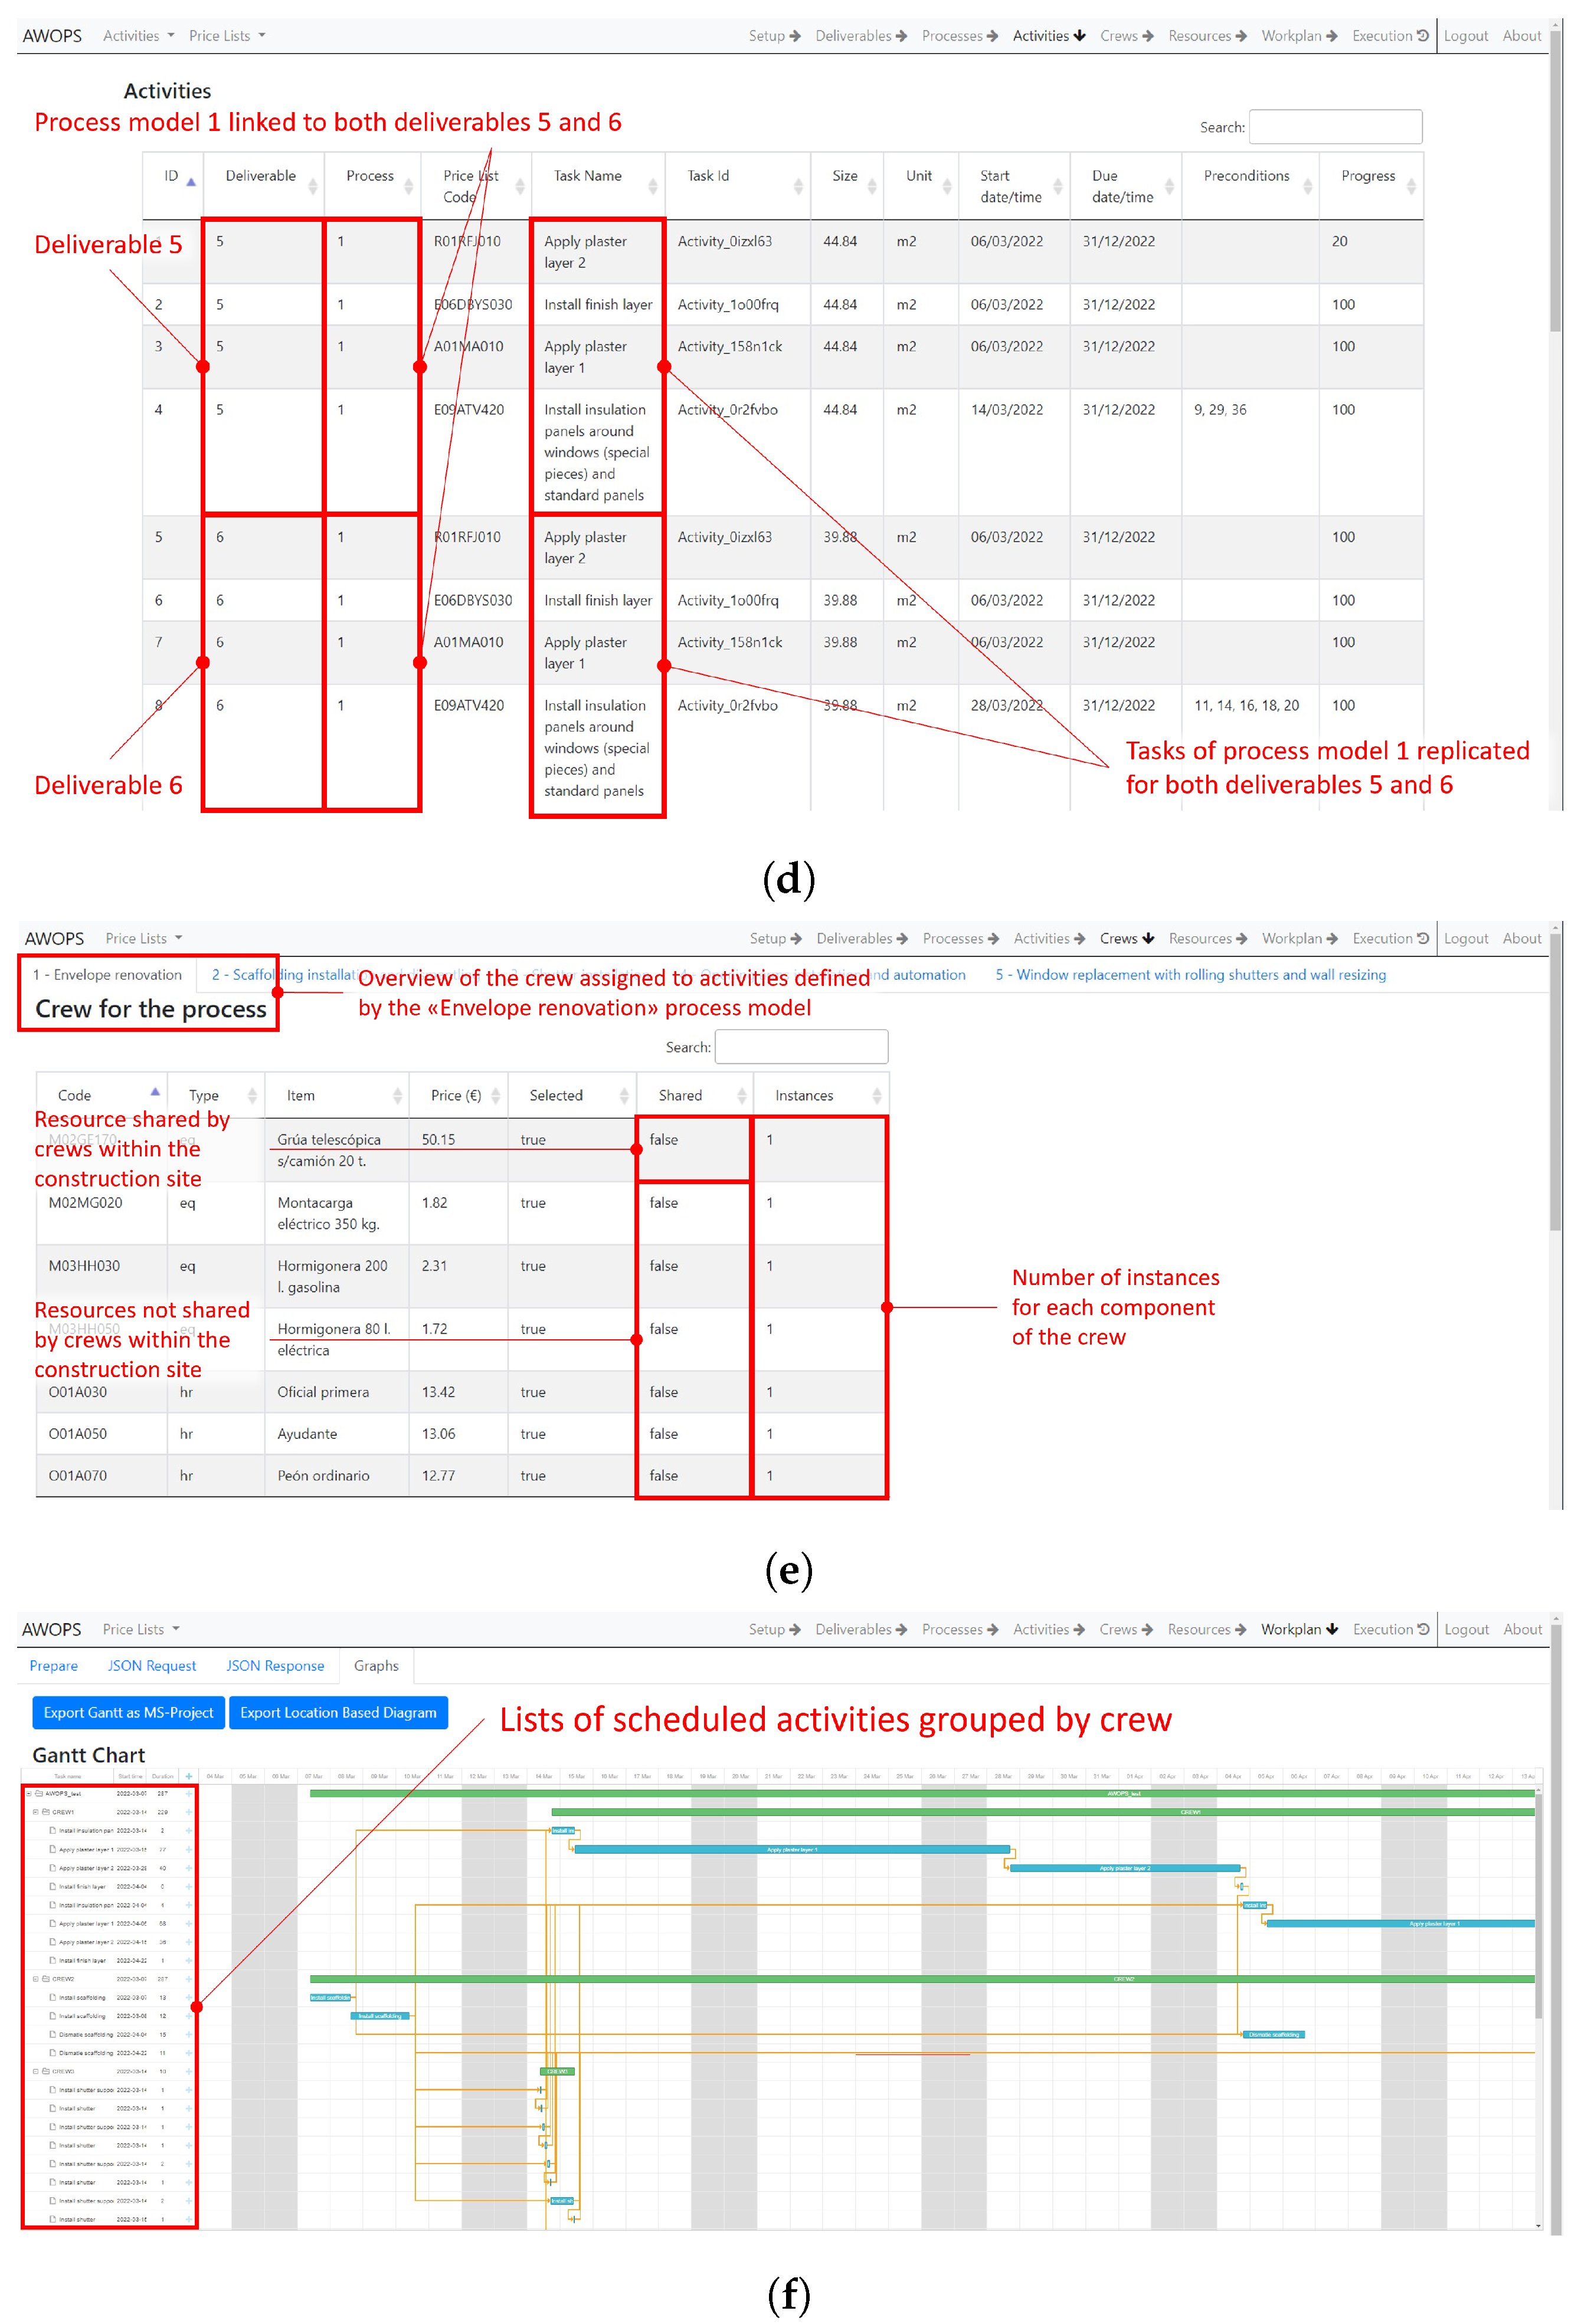
2.3.3. Activities Checkout

The fourth phase is performed automatically within the activities checkout Web GUI (Figure 5). The tool exploits the link between BPMN tasks and price list activities. Indeed, for each deliverable associated to a process, this phase instantiates a different copy of each task in the BPMN process, denoting the fact that each task of the given process must be executed on the specified deliverable with its resources (e.g., time, crews, and equipment) (Figure 4d).

2.3.4. Crew Definition and Resources Checkout

In the fifth phase (Figure 5), the user navigates the crew definition Web GUI, where they are allowed to pick out those resources that will be shared by crews within the same construction site (Figure 4e). The reason why these decisions are made is that resources contribute to indirect costs in different ways, depending on the use and sharing level that is performed during the work. For each process task, the information of the smallest crew required to accomplish the task is taken, and the crews of each task are “joined” together to form the (minimal) crew required to accomplish the overall process.

2.3.5. Baseline Generation

The seventh phase of the replanning workflow is supported by the baseline generation Web GUI (Figure 5). Once the resources checkout has been confirmed, AWOPS produces a JSON document that accommodates all the information, and this is posted as input for the planner service embedded in AWOPS. A stigmergic optimization algorithm based on the Ant Colony System is adopted to perform simulations necessary for the “what-if” analysis. The basic Ant Colony Optimization (ACO) idea is that a large number of simple artificial agents are able to build good solutions to hard combinatorial optimization problems via low-level based communications [51]. The algorithm starts to generate m ants and, in the event of replanning actions, only after having loaded work progress and last generated pheromones from the input document. Each ant starts from the last activity i performed, if any, and computes a delivery time for the others. A heuristic penalty is computed, based on the remaining time for each activity with respect to the associated due date: the ones with the closest deadline are favored. The attractiveness of the possible activities is then computed based on the penalty η i j and the pheromones τ i j proportionally to η i j α · τ i j β with scalar exponents α , β . This attractiveness is then modulated by the feasibility constraints for excluding unfeasible activities (because they have been already completed, the current time is not compatible with their time window, or the preconditions have not been completed). The resulting probability distribution is used for randomly sorting out the next activity. When an ant has explored the whole set of activities, the cost of the solution J is evaluated together with an update of the cost associated to the best solution J g b obtained at that moment. By comparison, the updated best solution is determined, and the pheromone trail matrix is updated both locally, by computing τ i j according to Equation (1):
τ i j = ( 1 ρ ) · τ i j + ρ · τ 0 ,
and globally, by computing τ i j according to Equation (2):
τ i j = ( 1 ρ ) · τ i j + ρ / J g b .
Future ants will use this information to generate new solutions around the best solution. The process is iterated, generating m ants again until a termination condition is met.
When a solution exists, even if this algorithm finds a global optimum to the optimization problem, its first advantage is that it is able to find a feasible sub-optimal solution in a finite time: the longer the time available for computing, the more accurate the solution. The second feature of the algorithm is that successive solution searches start from the last one and try to keep alternatives close to it. This stigmergic approach, adopted for the purpose of AWOPS, adapts the optimization algorithms used in the literature for the Vehicle Routing Problem (VRP): the search is performed by an artificial ant colony designed to try to optimize a cost function associated with the tour that covers all the customers. In this application, the resource base adopted by the planner is the crew, formed by a given size of equipment and workers. Customers, on the other hand, correspond to activities performed on a specific deliverable.
The simulation takes place in AWOPS by invoking a Matlab™ [53] simulation environment. To this purpose, a REST API has been developed using NodeRED by means of an asynchronous POST/GET mechanism. The resulting baseline must be checked spatially before being used as the reference work plan to manage works execution. For this purpose, the baseline generation Web GUI implements a functionality that allows the user to export the automatically generated work plan both in JSON and XML formats (Figure 5). The work plan in JSON format is applied for the following spatial simulation, whereas the one in XML format enables interoperability with commercial project management software tools (e.g.,Microsoft Project [54] ). A view of the baseline displayed within AWOPS is depicted in Figure 4f.

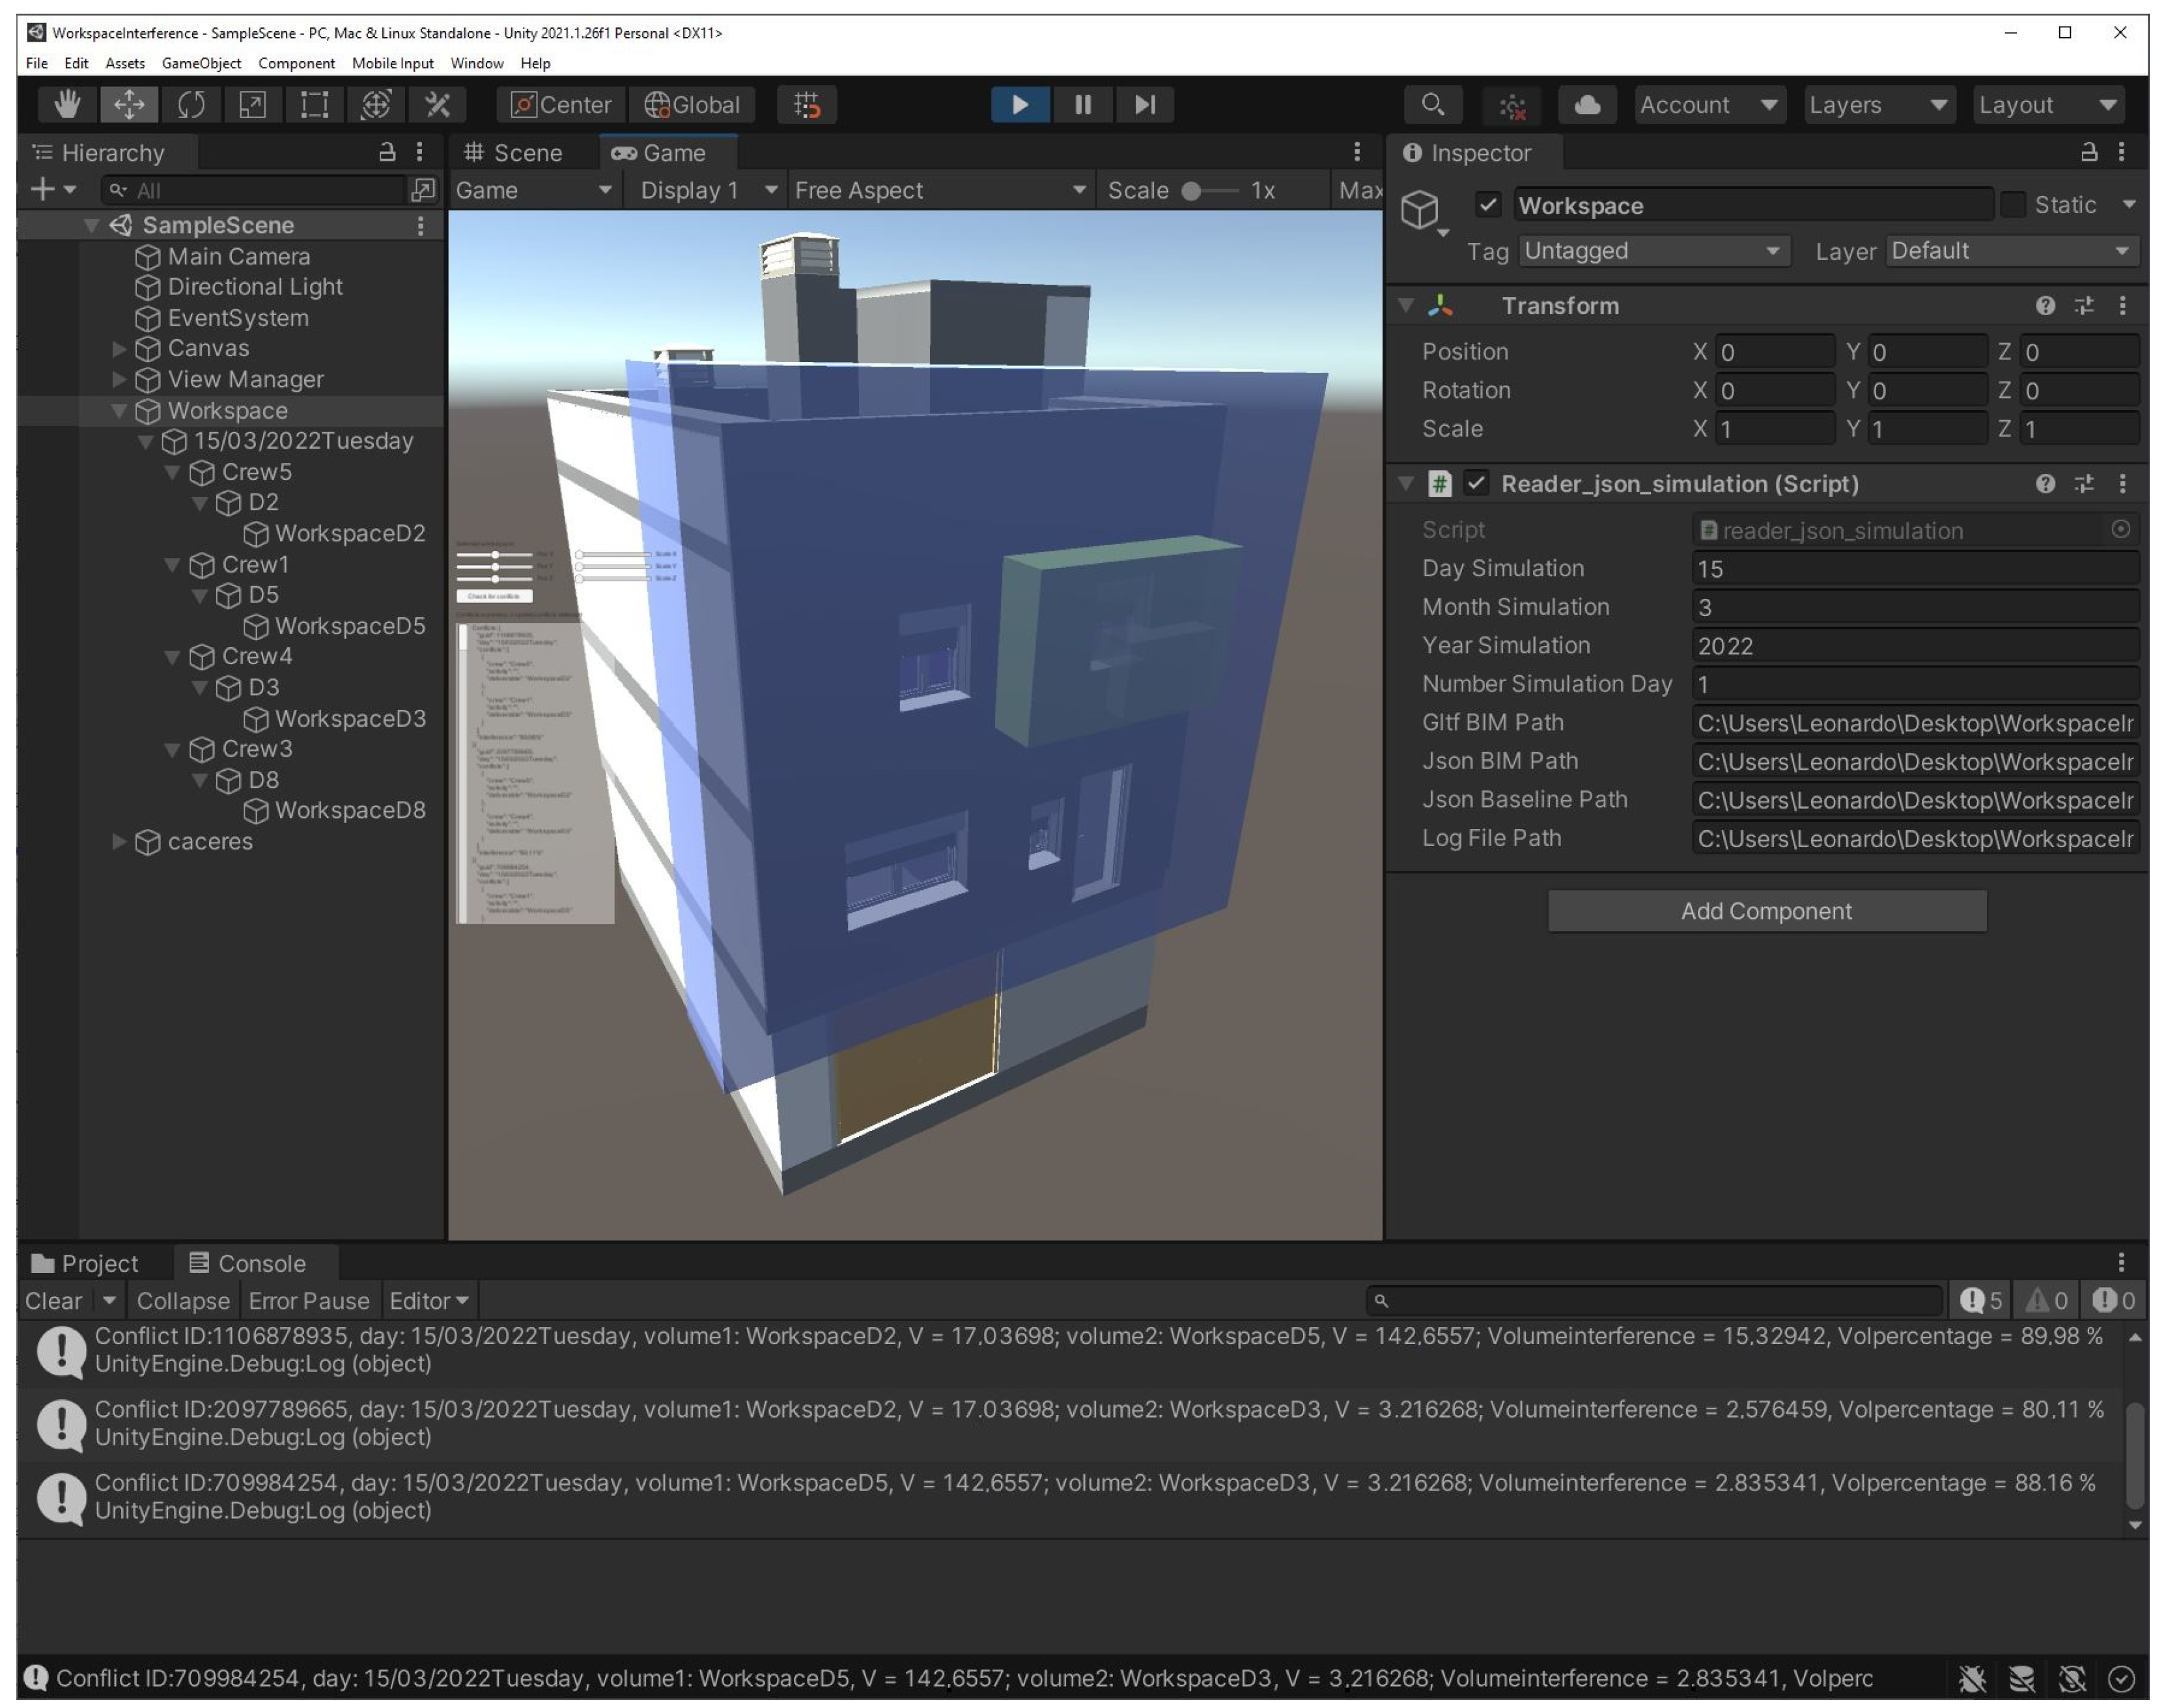
2.3.6. Spatial Simulation of the Work Plan
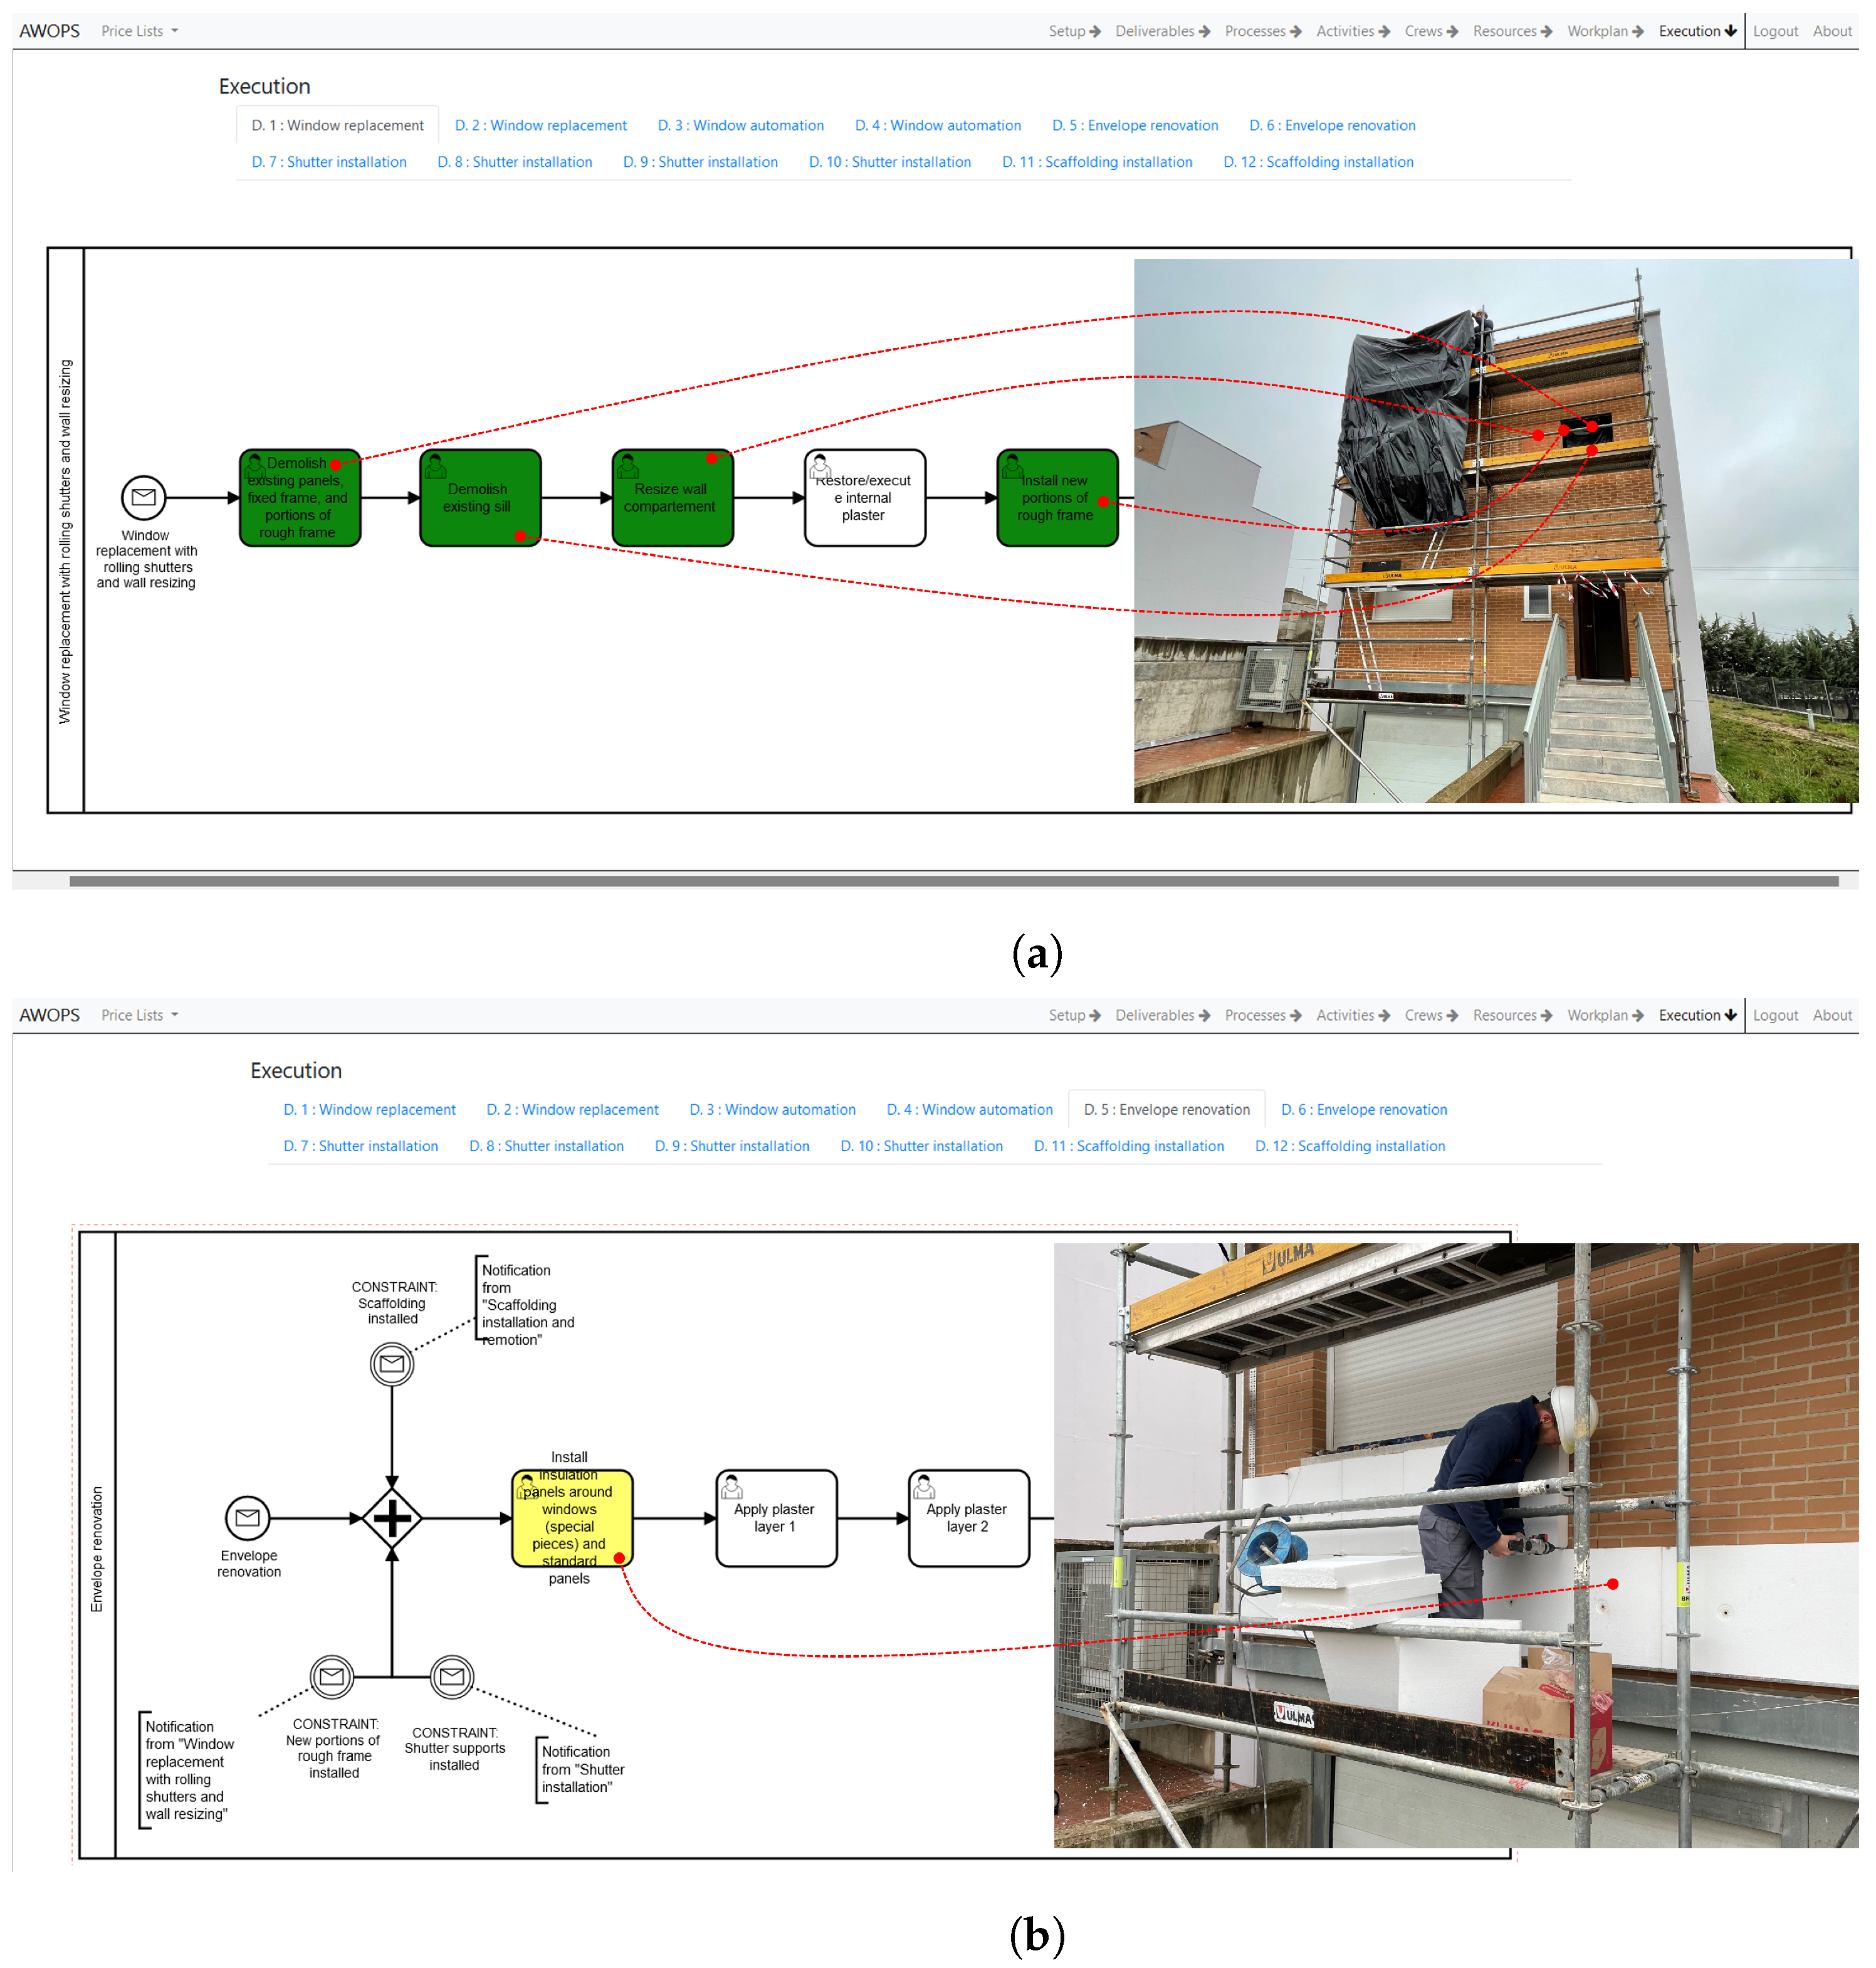
Prior to and during the work, every new baseline that is generated by AWOPS is checked by the planner also using the proposed SCS, which produces a list of those workspaces experiencing any conflict, to enable the user to make a decision about the need to change the baseline based on this feedback.
The spatial conflicts simulator service is an external service developed within the Unity3DTM development environment (Figure 6). The application of SCS integrates the replanning workflow described thus far. SCS consists of four main units: a glTF importer, a JSON importer, a workspace generator, and a spatial conflicts detector. The glTF importer loads onto the scene with the latest version of the IFC model of the building being renovated. The JSON importer enables the latest version of the work plan worked out by the planner service to be imported. The workspace generator generates one workspace for every deliverable in progress on the date of the simulation; the workspace is a volume including all the products that have been associated with the activity performed by every crew, to which a space offset is added, to satisfy operational needs. Finally, the spatial conflicts detector intersects workspaces and filters out those conflicts that are not eligible, such as two workspaces assigned to the same crew; the outcome is a list of conflicts, each of them including the interested workspaces, the date, the crews and deliverables involved. The input to this simulator is the latest version of the work plan in JSON format generated by and exported from AWOPS, and the IFC model of the renovated building. The crew leaders can check whether any plan change is needed and, in the event that changes are required, they must cooperate with the involved crews to attempt to solve the problem locally or, if necessary, involving the planner.

2.3.7. Execution

The last phase of the proposed replanning workflow is supported by the execution Web GUI (Figure 5). In this phase, the monitoring of the actual progress during the work is expected to be provided by the supervisor (e.g., field manager/engineer) by means of an external service which sends data to AWOPS through a REST API. These data are used for a twofold function. The first one consists of updating color charts applied to BPMN process models, displayed in this Web GUI to provide an effective overview of activities work progress. The second one consists of populating the input file of the planner service, which can be run again to work out a new feasible work plan.

2.4. Performance Indicators

This section presents the performance indicators adopted to measure the performance of the proposed system during the onsite demonstration of the planning and monitoring phases of renovation works. Two KPIs are related to the planning phase: process smoothness, and cost tracking.
A.1
The first one is determined by asking the supervisor, who assisted in all the replanning actions, to answer the following question with reference to the Likert scale: “How smooth is the pipeline to generate and download the schedule?” In the Likert scale adopted in this study, ranging from 1 to 4, a greater value corresponds to a higher level of satisfaction.
A.2
The second one, given the cost function values generated by AWOPS for each replanning of works, stores their variation from the baseline across time. It must be specified that the cost function values are computed with reference to the totality of works, regardless of progress.
Four KPIs, on the other hand, are defined to assess the contribution of the proposed system in the field of the renovation works monitoring: clashes adjustment, detectability of spatial conflicts, work progress update, and work progress visualization.
B.1
The first one is determined by asking the supervisor who assisted in all the replanning actions to answer to the following question with reference to the aforementioned Likert scale: “Were crew leaders able to resize workspaces and solve clashes locally in the SCS”
B.2
The second one calculates the ratio between the number of spatial conflicts detected by SCS and the maximum number of potential occurrences.
B.3
The third one is determined by asking the supervisor who assisted in all the replanning actions to answer to the following question with reference to the aforementioned Likert scale: “How easy is it to update work progress in the web service?”
B.4
The fourth one is determined by asking the supervisor who assisted in all the replanning actions to answer to the following question with reference to the aforementioned Likert scale: “How informative is the visualization of the work progress in the web service?”

3. Experiments Design and Results

3.1. Design of Experiments

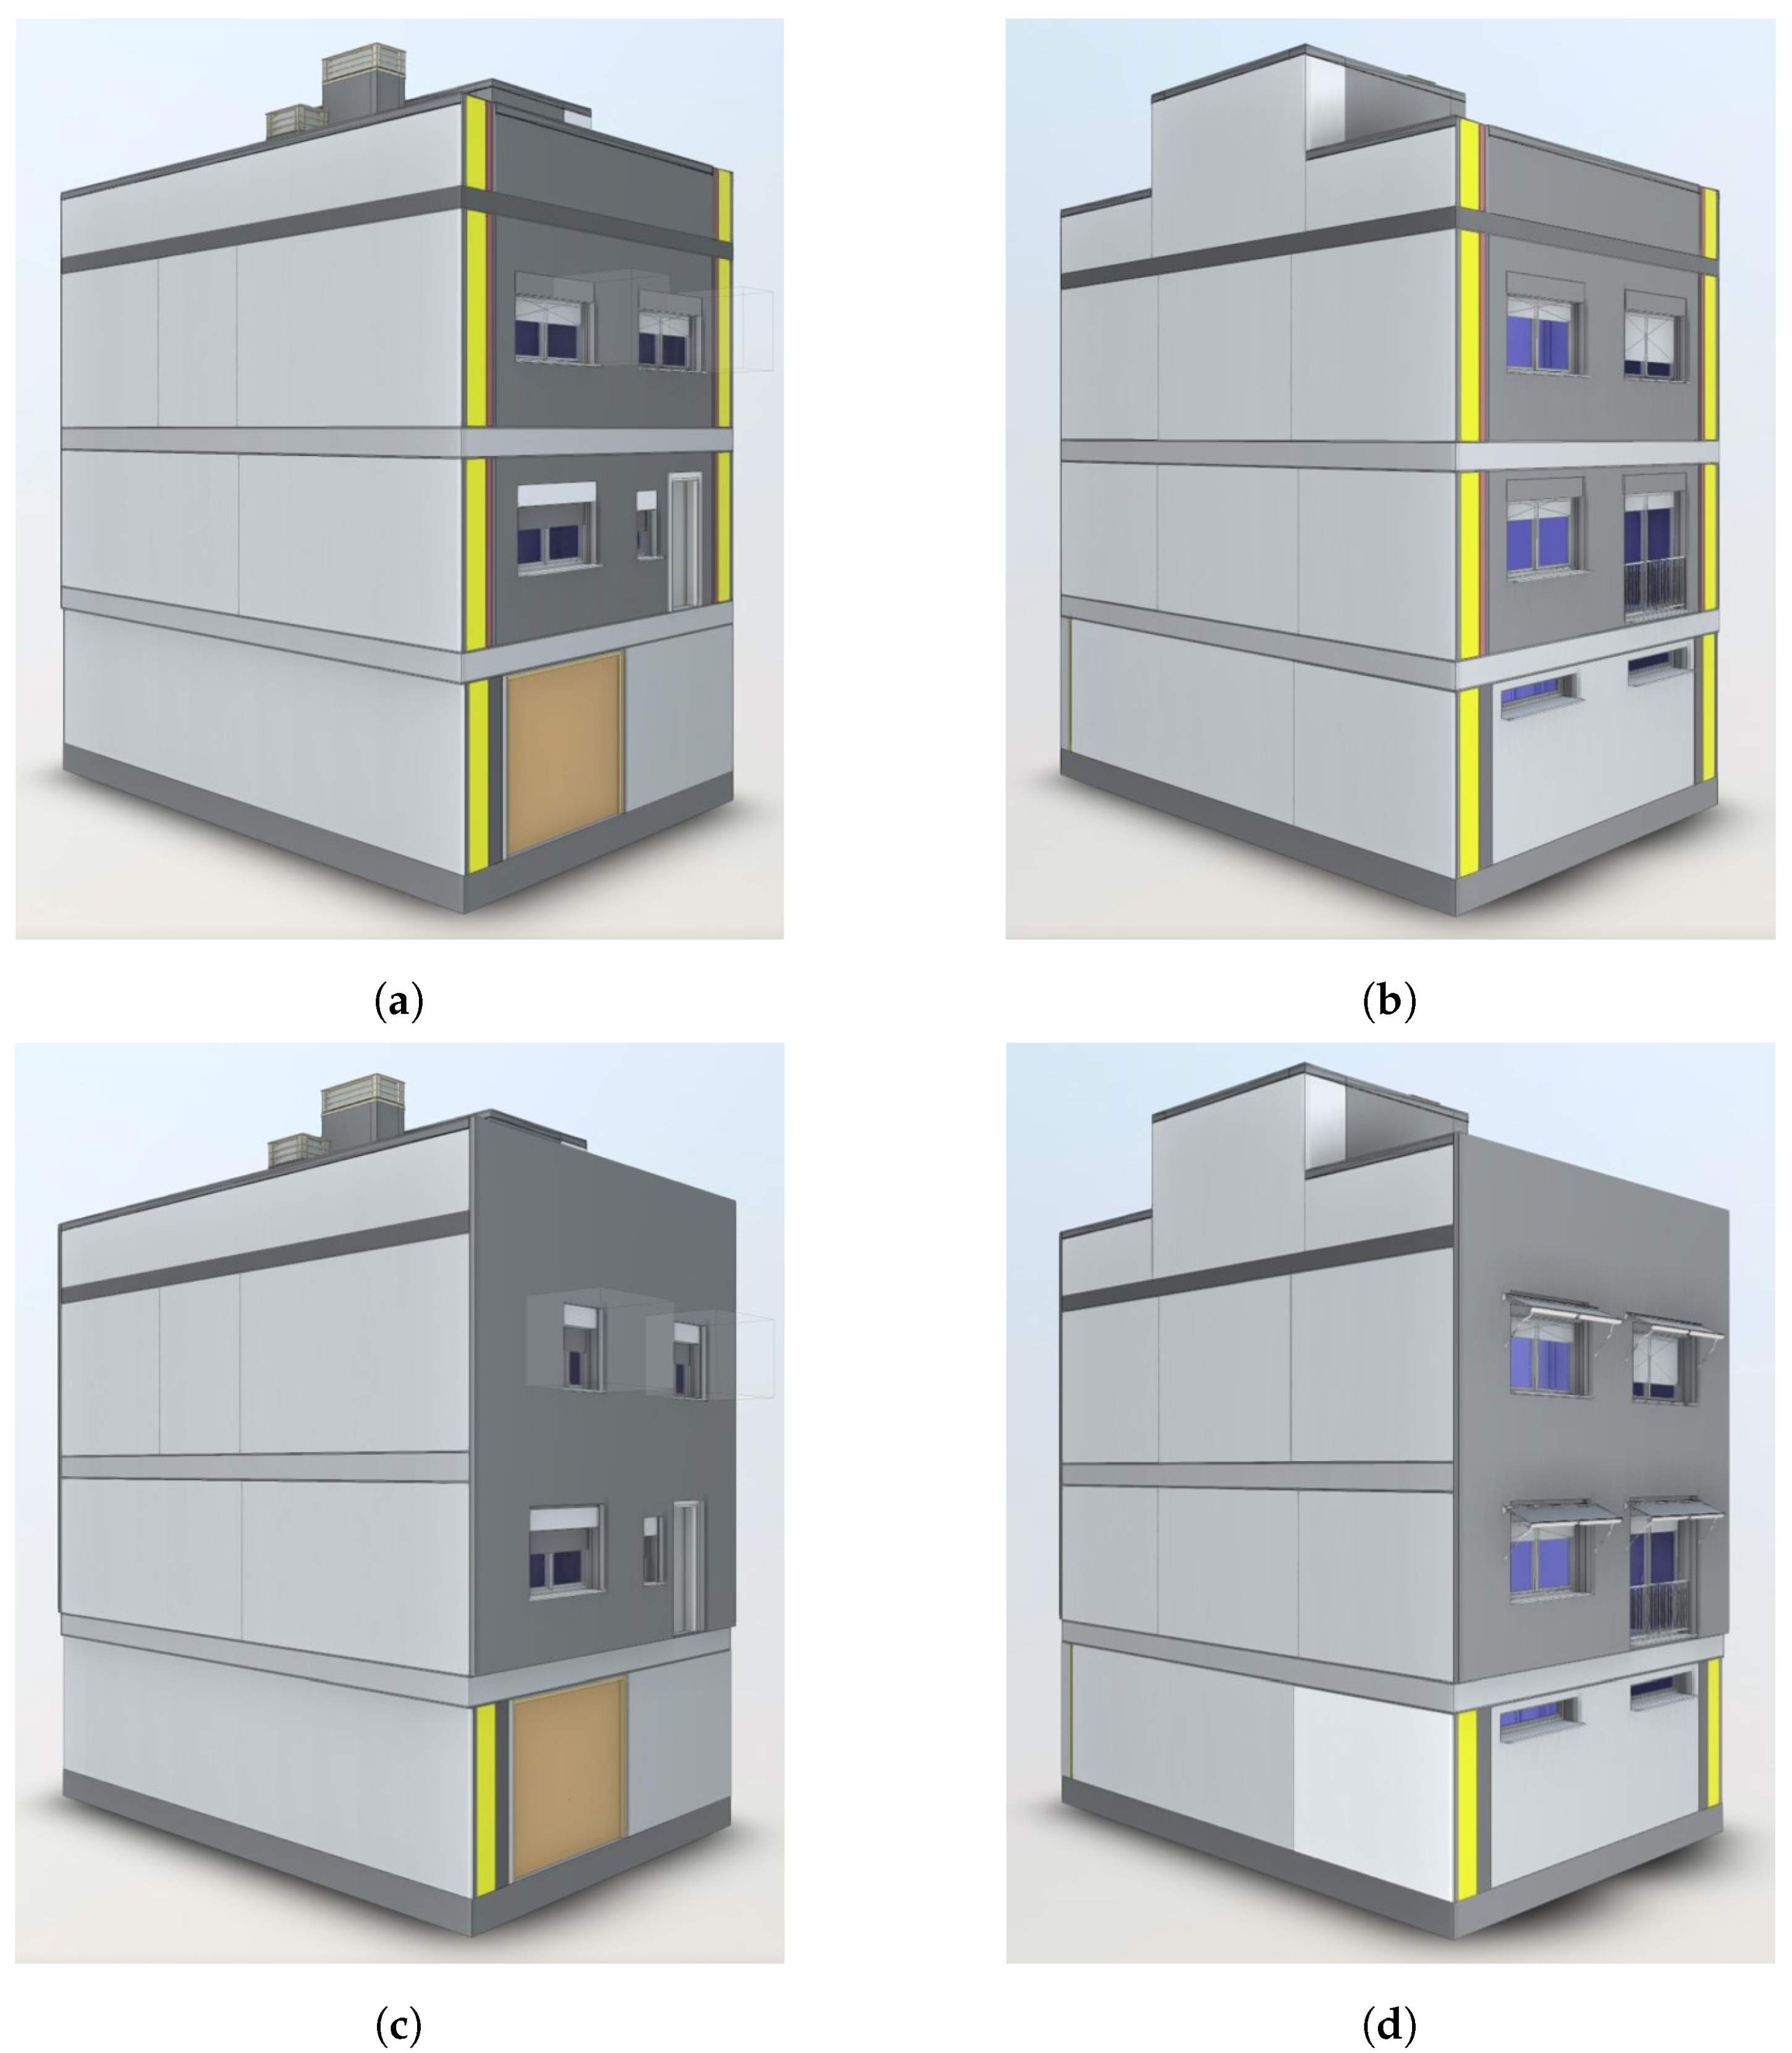
3.1.1. The Renovation Project

The use case chosen for the validation of the proposed holonic process-based construction management system is an experimental building located in Cáceres (Spain). It is a two-story building which has an approximately square plan, with windows on the shorter sides, that is, on the east and west façades; a door on the south façade defines the main access to the building. An internal staircase connects the ground floor to the first floor, and then the first floor to the roof.
Figure 7 reports views of the north and south facades related, respectively, to the existing and new construction phases, the latter resulting from the execution of energy renovation works. Figure 7c, compared to Figure 7a, shows that the renovated building has, on the north facade, a renovated envelope and windows replaced with smaller ones at the first level. These new windows include rolling shutters and opening arms for their automation. Figure 7d, compared to Figure 7b, shows that, on the south, the renovated building has a renovated envelope and external shutters installed in correspondence with the four windows.

3.1.2. The Work Commitment

In order to implement the new construction configuration presented in the previous subsection, the following jobs must be completed: replacement of two windows on the north facade, first floor, with new smaller ones including rolling shutters; installation and automation of opening arms for the two windows on the north facade, first floor; renovation of the envelope on the north and south facades; installation of the shutters on the four windows on the south facade; and installation of scaffolding on the north and south facades.
The experimental building (i.e., EDEA CICE) where the construction work was carried out is owned by the regional government of Extremadura (i.e., Junta de Extremadura). Given that it is part of the public Administration, the type of work services contract had to be assigned through a public tender process. In this case, due to the low estimated budget, that was below the EUR 50,000 threshold, the type of tender used was the restricted procedure. The winning company was the one which made a bid that best fit the technical and financial requirements set out in the technical specifications required by Junta de Extremadura.

3.2. Experiment Conduction

The renovation works presented in the previous subsection were carried out between 7 March 2022 and 11 April 2022. Table 1 reports an overview of the experiments carried out during the renovation work in the experimental building used as a case study. The first work plan, e.g., the baseline, was generated on day 0 (i.e., 6 March 2022), before the work started. Work progress was monitored twice a week, on Mondays and Thursdays, the only exception being the first week. On the same days, replanning action was taken, involving a total of eight work plan updates. On day 36 (i.e., 11 April 2022), since the work progress monitoring revealed the completion of renovation work, no replanning action was required. Data regarding generated work plans for the whole duration of renovation work are available online within a Zenodo repository [55]. In the following subsections, data related to experiments carried out on day 0 (i.e., 6 March 2022), day 8 (i.e., 14 March 2022), and day 32 (i.e., 7 April 2022) are reported and discussed.

3.2.1. Generation of the Baseline on Day 0

On day 0 (i.e., 6 March 2022), the planner (i.e., project manager/engineer) accesses the project initialization UI (i.e., “Setup” in Figure 4a) where they can create a project or select an existing one. Given that this is the first access, a new project is created, and its metadata are provided by filling in the fields shown at the top of Figure 4a. Afterwards, two IFC files, one relating to the existing phase and the other one to the new construction phase, are imported into the proposed system. At this point, the planner clicks on the “Extract deliverables” button to compare the two provided IFC files and automatically computes the list of building elements to be demolished and/or built, constituting the flat PBS, stored within a CSV file.
By doing so, the second UI (i.e., “Deliverables” in Figure 4b), regarding the deliverables definition, is accessed. Here, the planner clusters the aforementioned building elements into deliverables by editing and assigning the same ordering number (i.e., “ID” field) to those components that will be executed by the same crew in the same work location. By way of example, the first four records in Figure 4b are grouped by assigning the same ID (i.e., 1) to define a deliverable, which is the replacement of a window. With the same approach, the following 12 deliverables are defined in total (Figure 4b): two related to the replacement of windows on the north facade, first floor, with new smaller ones including rolling shutters; two related to the installation and automation of opening arms the north facade, first floor; two related to the renovation of the envelope on the north and south facades; four related to the installation of the shutters on windows on the south facade; and two related to the installation of scaffolding on the north and south facades.
The work performed by the user in this step aims to elicit their expert knowledge, with particular reference to the operational approach to be adopted in the execution phase.
Before associating deliverables and processes, the latter must be defined. Figure 4c depicts the BPMN editor hosted by the third UI regarding processes definition (i.e., “Processes”). As shown in the same figure, the notation of BPM is made of start message events, tasks (e.g., “Demolish existing panels, fixed frame, and portions of rough frame”), parallel gateways to indicate that some tasks can be performed concurrently, and end message events. Constraints are defined by combining a parallel gateway icon and an intermediate message event, such as in the case of the “Install new portions of rough frame” task, whose completion releases other tasks in another process, e.g., “Envelope renovation” (Figure 4c). This is also the UI in which every task that forms a process is assigned to one item of the price list that is valid for the project. The result of such an association is stored in one of the “extension” fields associated with every task of the processes. Figure 4c reports, on the right, that the price list code “R01RTM010” is associated with the task “Demolish existing panels, fixed frame, and portions of rough frame”. The following five BPMN process models are defined in total according to the approach described above: window replacement; window automation; envelope renovation; shutter installation; and scaffolding installation.
Once each deliverable has been assigned to a process model, the planner saves and accepts the deliverable grouping by clicking on the assigned button at the bottom of the second UI presented above.
The results of the association between processes and deliverables are displayed by the activities checkout UI (i.e., “Activities” in Figure 4d). Here, the planner checks the correctness of the “size” fields, adjusts them if necessary, and applies temporal constraints by updating “startDateTime” and “dueDateTime” fields. Table 2 reports the list of activities whose “startDateTime” field has been updated by the planner at this phase of the experiment.
The results of the association between processes, deliverables and price list, on the other hand, are displayed by the next two UI, namely crews definition (i.e., “crews” in Figure 4e) and resources checkout (i.e., “resources”).
The information generated across the steps described above is rearranged by AWOPS within a JSON file. The user checks the inputs required by the planning algorithm and starts the simulation. When simulation is finished, the resulting workplan is displayed within the same Web GUI (Figure 4f) and externally, by importing the related XML file to a commercial project management software tool, like Microsoft Project (Figure 8).
Before being delivered to the construction site, the automatically generated workplan (Figure 8) must be spatially checked. This is possible via the link that connects AWOPS to the external simulation tool called SCS (Figure 6) through JSON and IFC file formats. The latter, in fact, imports the IFC file of the building and the JSON file storing the workplan. Results of spatial analysis carried out by SCS for the workplan generated on day 0 (e.g., baseline) are reported in Table 3. For days that are not reported in this table (e.g., before day 8 and after day 11), there was no detection of interference. It must be noted that, even if a total number of eight spatial conflicts are detected, only the one detected on day 9 between deliverables D2 (i.e., window replacement on the north facade) and D3 (i.e., window automation on the north facade) represents a potential conflict. All the other seven spatial conflicts can be ignored since they do not imply any real risk of interference. In fact, taking day 9 as an example, deliverable D5 (i.e., envelope renovation of the north facade), which is performed outside the building, will not interfere with deliverables D2 and D3, which need to be performed inside. Figure 6 depicts SCS during the spatial analysis of the workplan generated on day 0 (i.e., baseline) and for day 9. Crew leaders did not deem it necessary to address the confirmed spatial interference that may occur on day 9 and the planner (e.g., project manager/engineer) decided to confirm and deliver the workplan generated on day 0 (i.e., baseline) to the construction site without adopting any corrective action since such potential spatial interference is not in the short term. Considering that spatial interferences affecting the workplan in the medium/long-term could be resolved without any actions in future replanning, it would be wasteful to address them immediately.

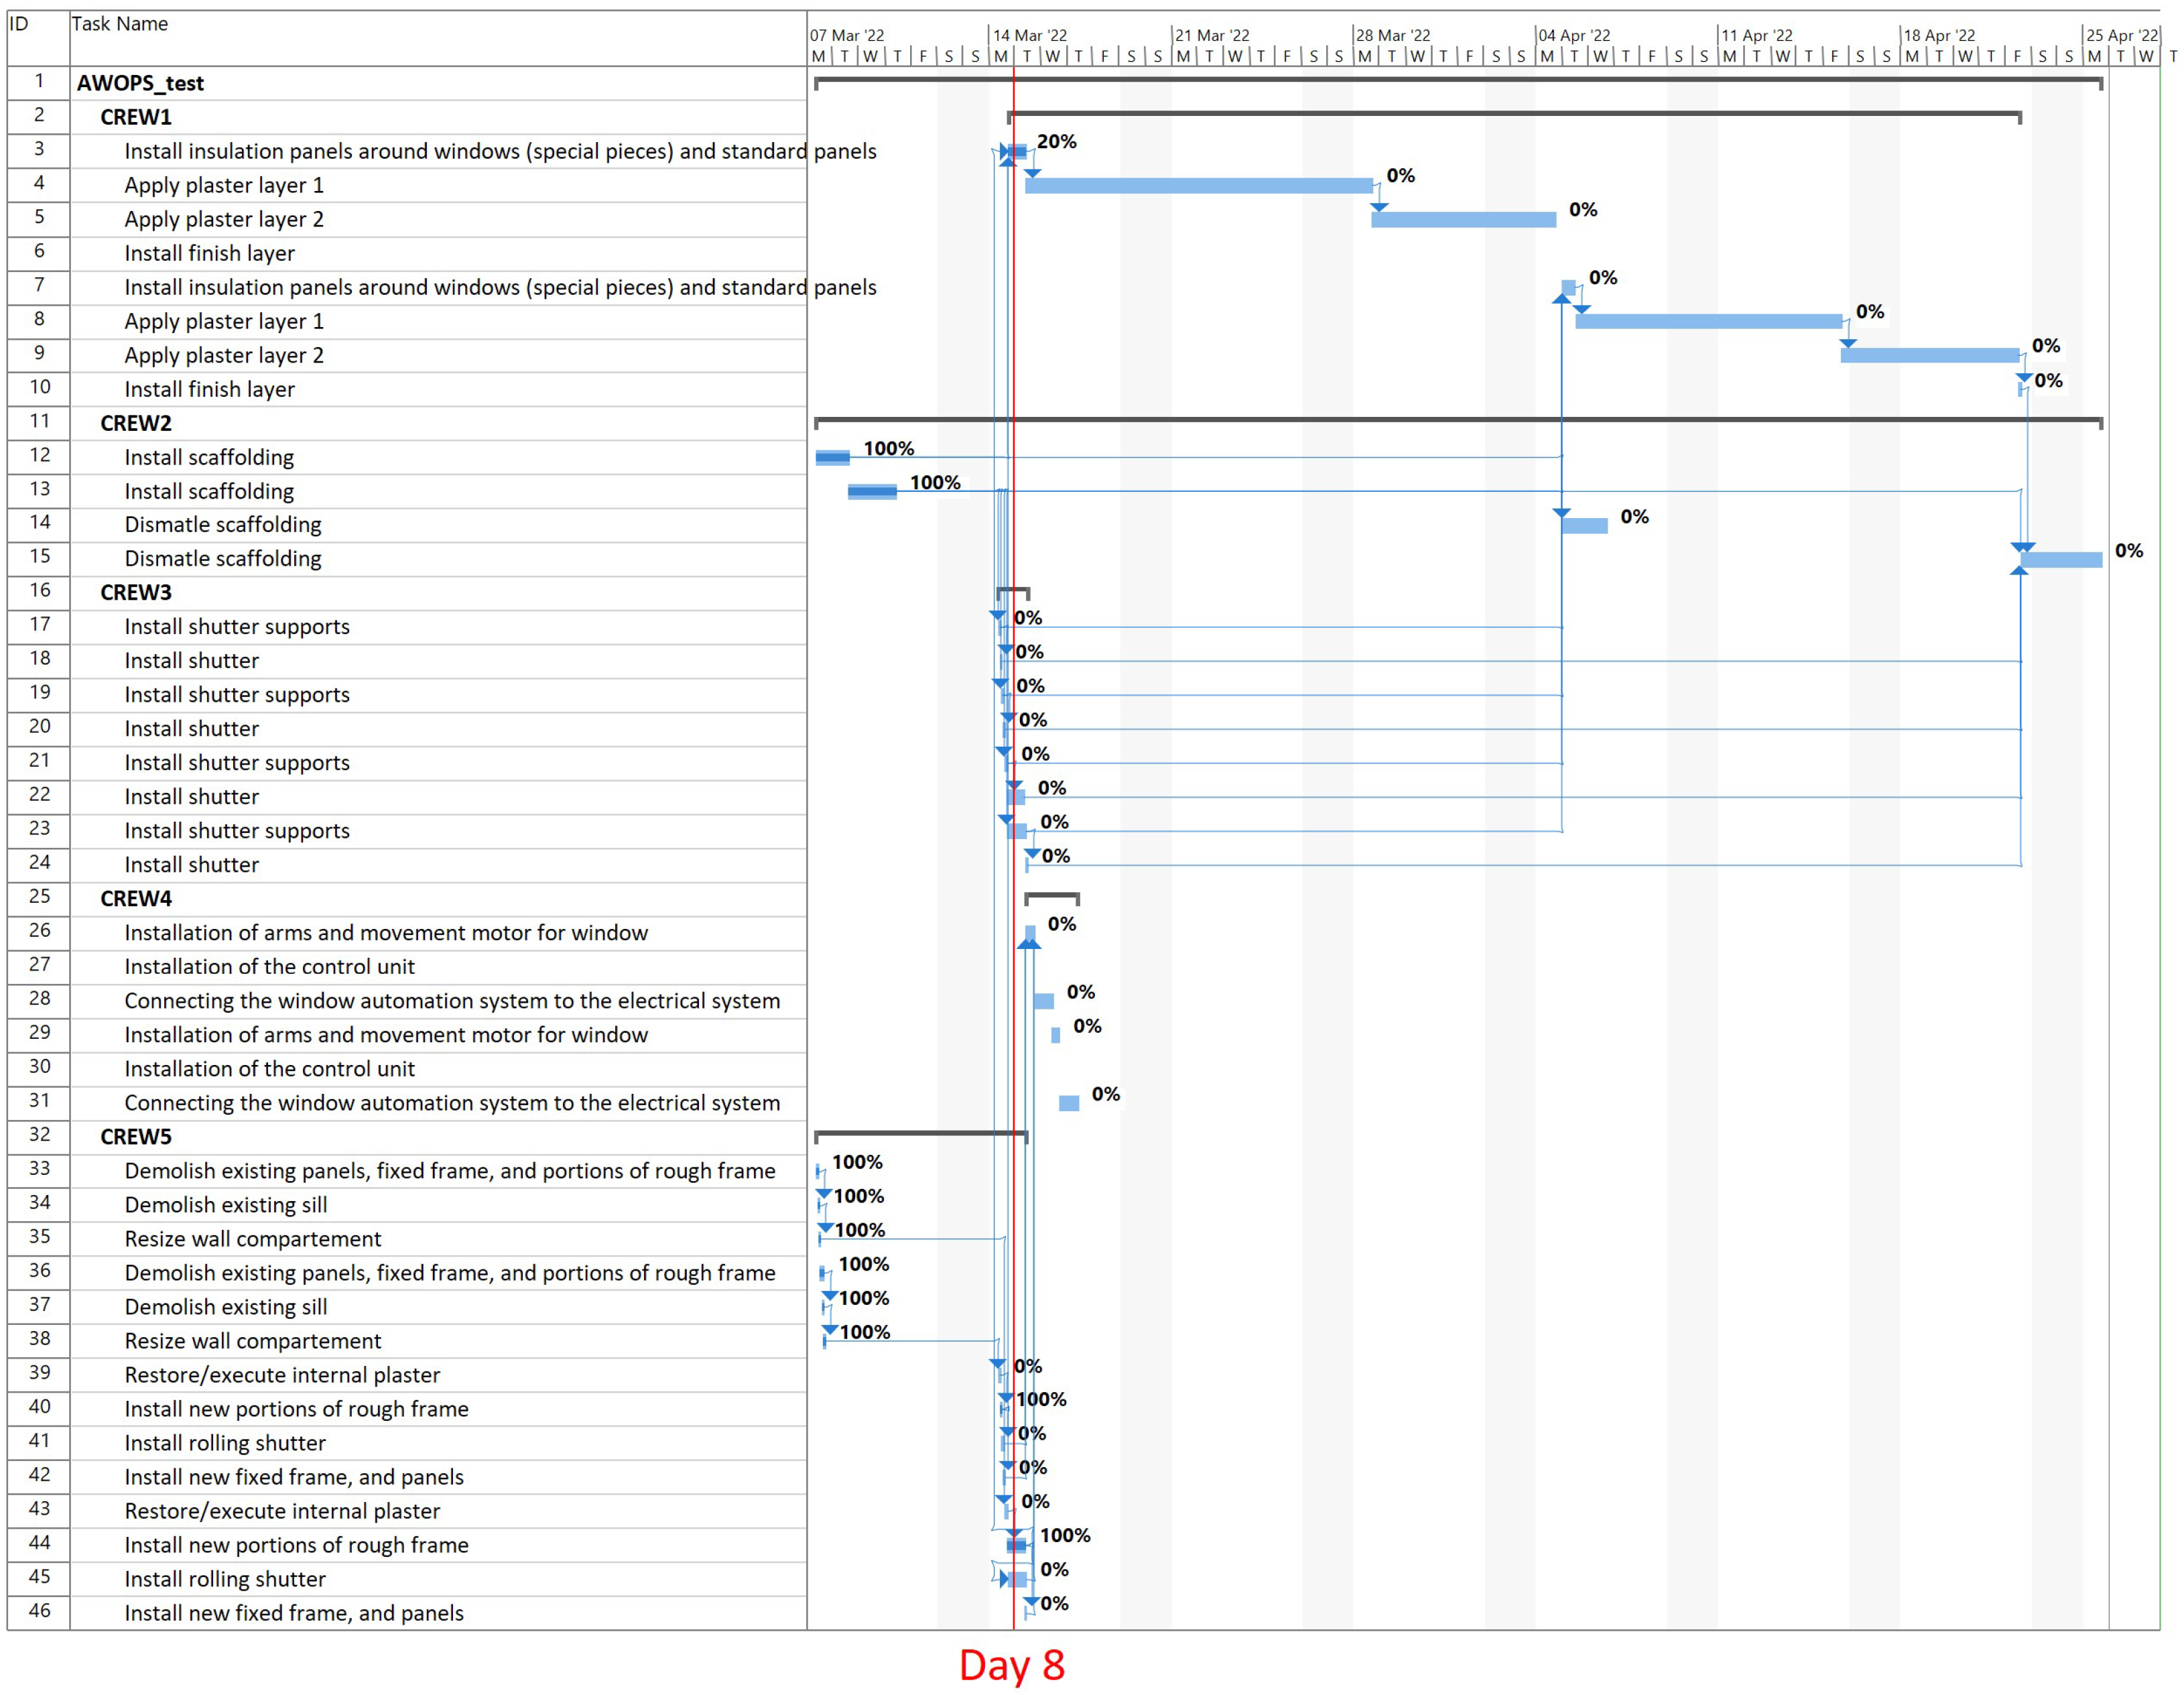
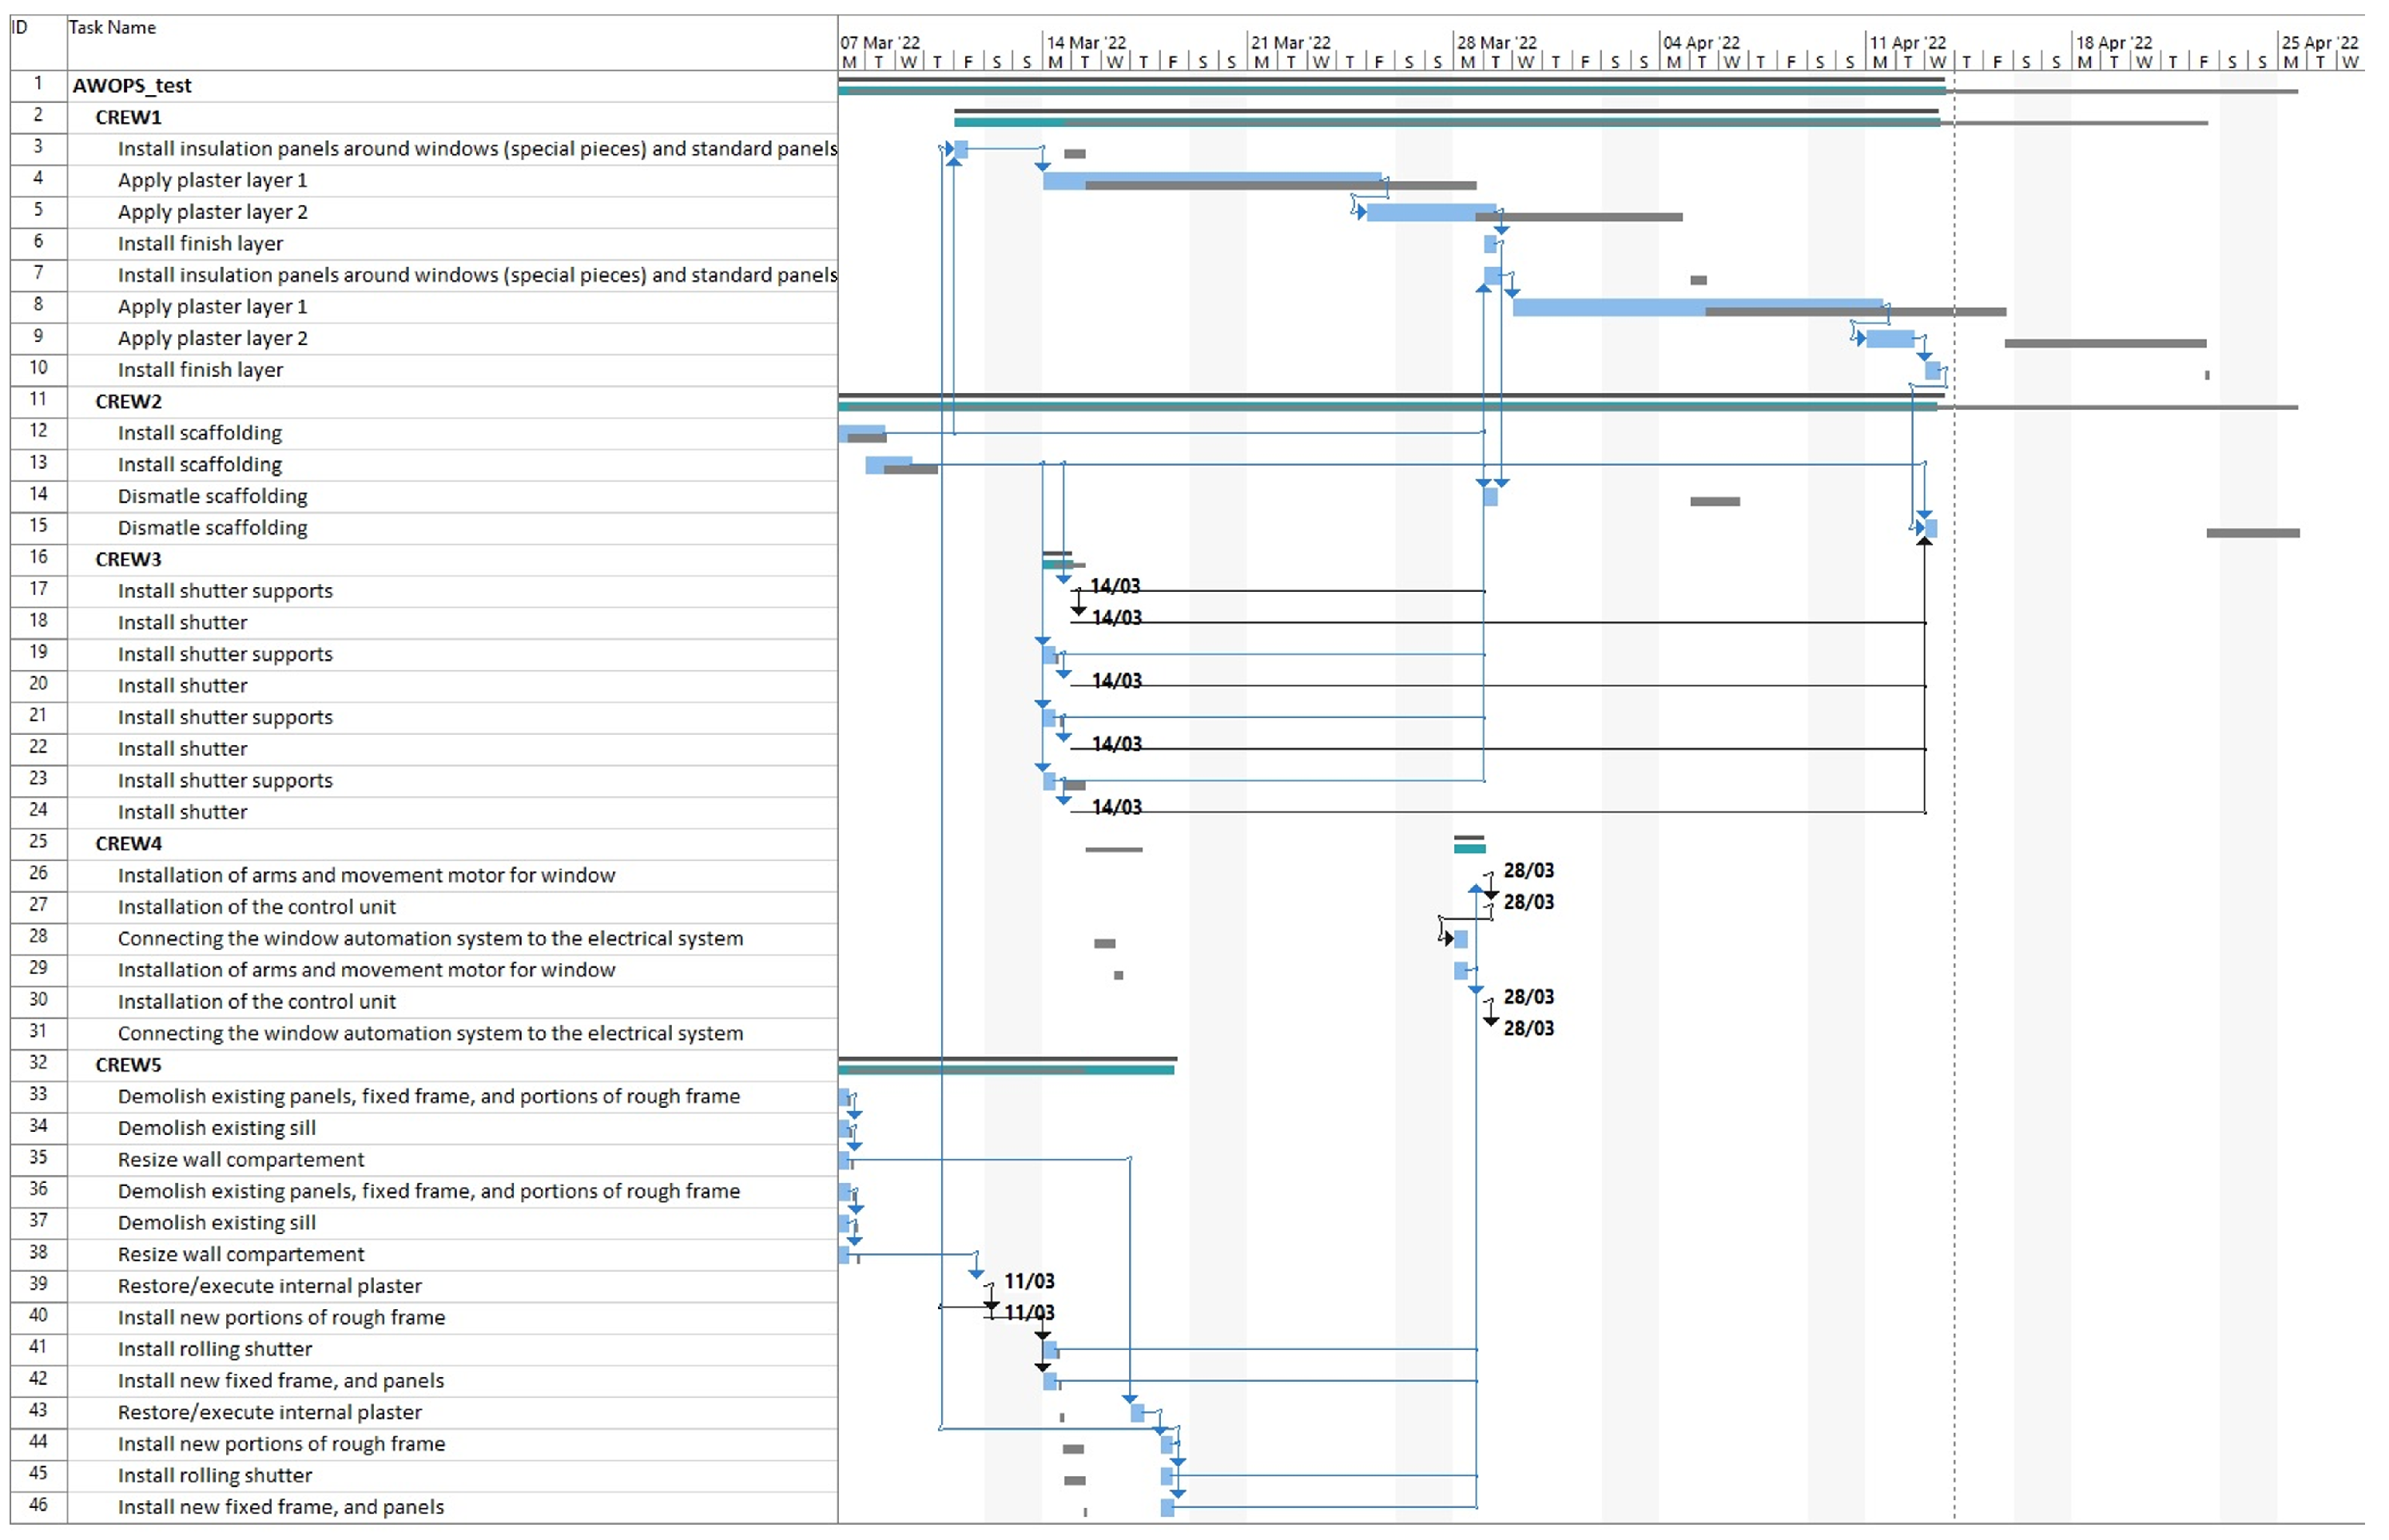
3.2.2. Replanning on Day 8

On day 8 (i.e., 14 March 2022), the supervisor carried out a site inspection to record and input work progress data into AWOPS. Figure 8 reports the percentage of completion on day 8 for each activity. As a result, the execution Web GUI (i.e., “execution” in Figure 9a) is updated accordingly.
In fact, in line with Figure 8, Figure 9a depicts the following activities of deliverable D1 (i.e., window replacement on the north facade) as completed (i.e., in green): “Demolish existing panels, fixed frame, and portions of rough frame”; “Demolish existing sill”; “Resize wall compartment”; “Install new portions of rough frame”. Instead, Figure 9b (as reported by Figure 8), depicts the following activity of deliverable D5 (i.e., envelope renovation on north facade) as in progress (i.e., light yellow filling corresponding to 20% completion): “Install insulation panels around windows (special pieces) and standard panels”.
Work progress data populate the planner service input file, along with the additional temporal constraints reported by Table 4. Such temporal constraints are defined by the planner (e.g., project manager/engineer).
Following the same procedure described in the previous subsection, the planner starts another planning algorithm simulation that generates another workplan (i.e., workplan day 8), reported in Figure 10. Spatial analysis, carried out by SCS for two days ahead (i.e., days 9 and 10), confirmed that the new workplan does not include any spatial interferences, confirming the expectations anticipated in the previous subsection. Spatial conflicts affecting the medium/long-term of the previous workplan were solved without applying any corrective action. In fact, the delivery of new window components was delayed due to a truck drivers’ strike. As a consequence, the activities related to deliverable D2 (i.e., window replacement on the north facade) were postponed until 18 March 2022, (Table 4), thus resolving the inherent spatial interference on day 9, as described in the previous subsection. Figure 10 also provides a comparison between the workplan generated on day 8 (i.e., light blue bars) and the one on day 0 (i.e., grey bars). It is clear how, in the new workplan, some activities were delayed while some others were brought forward.

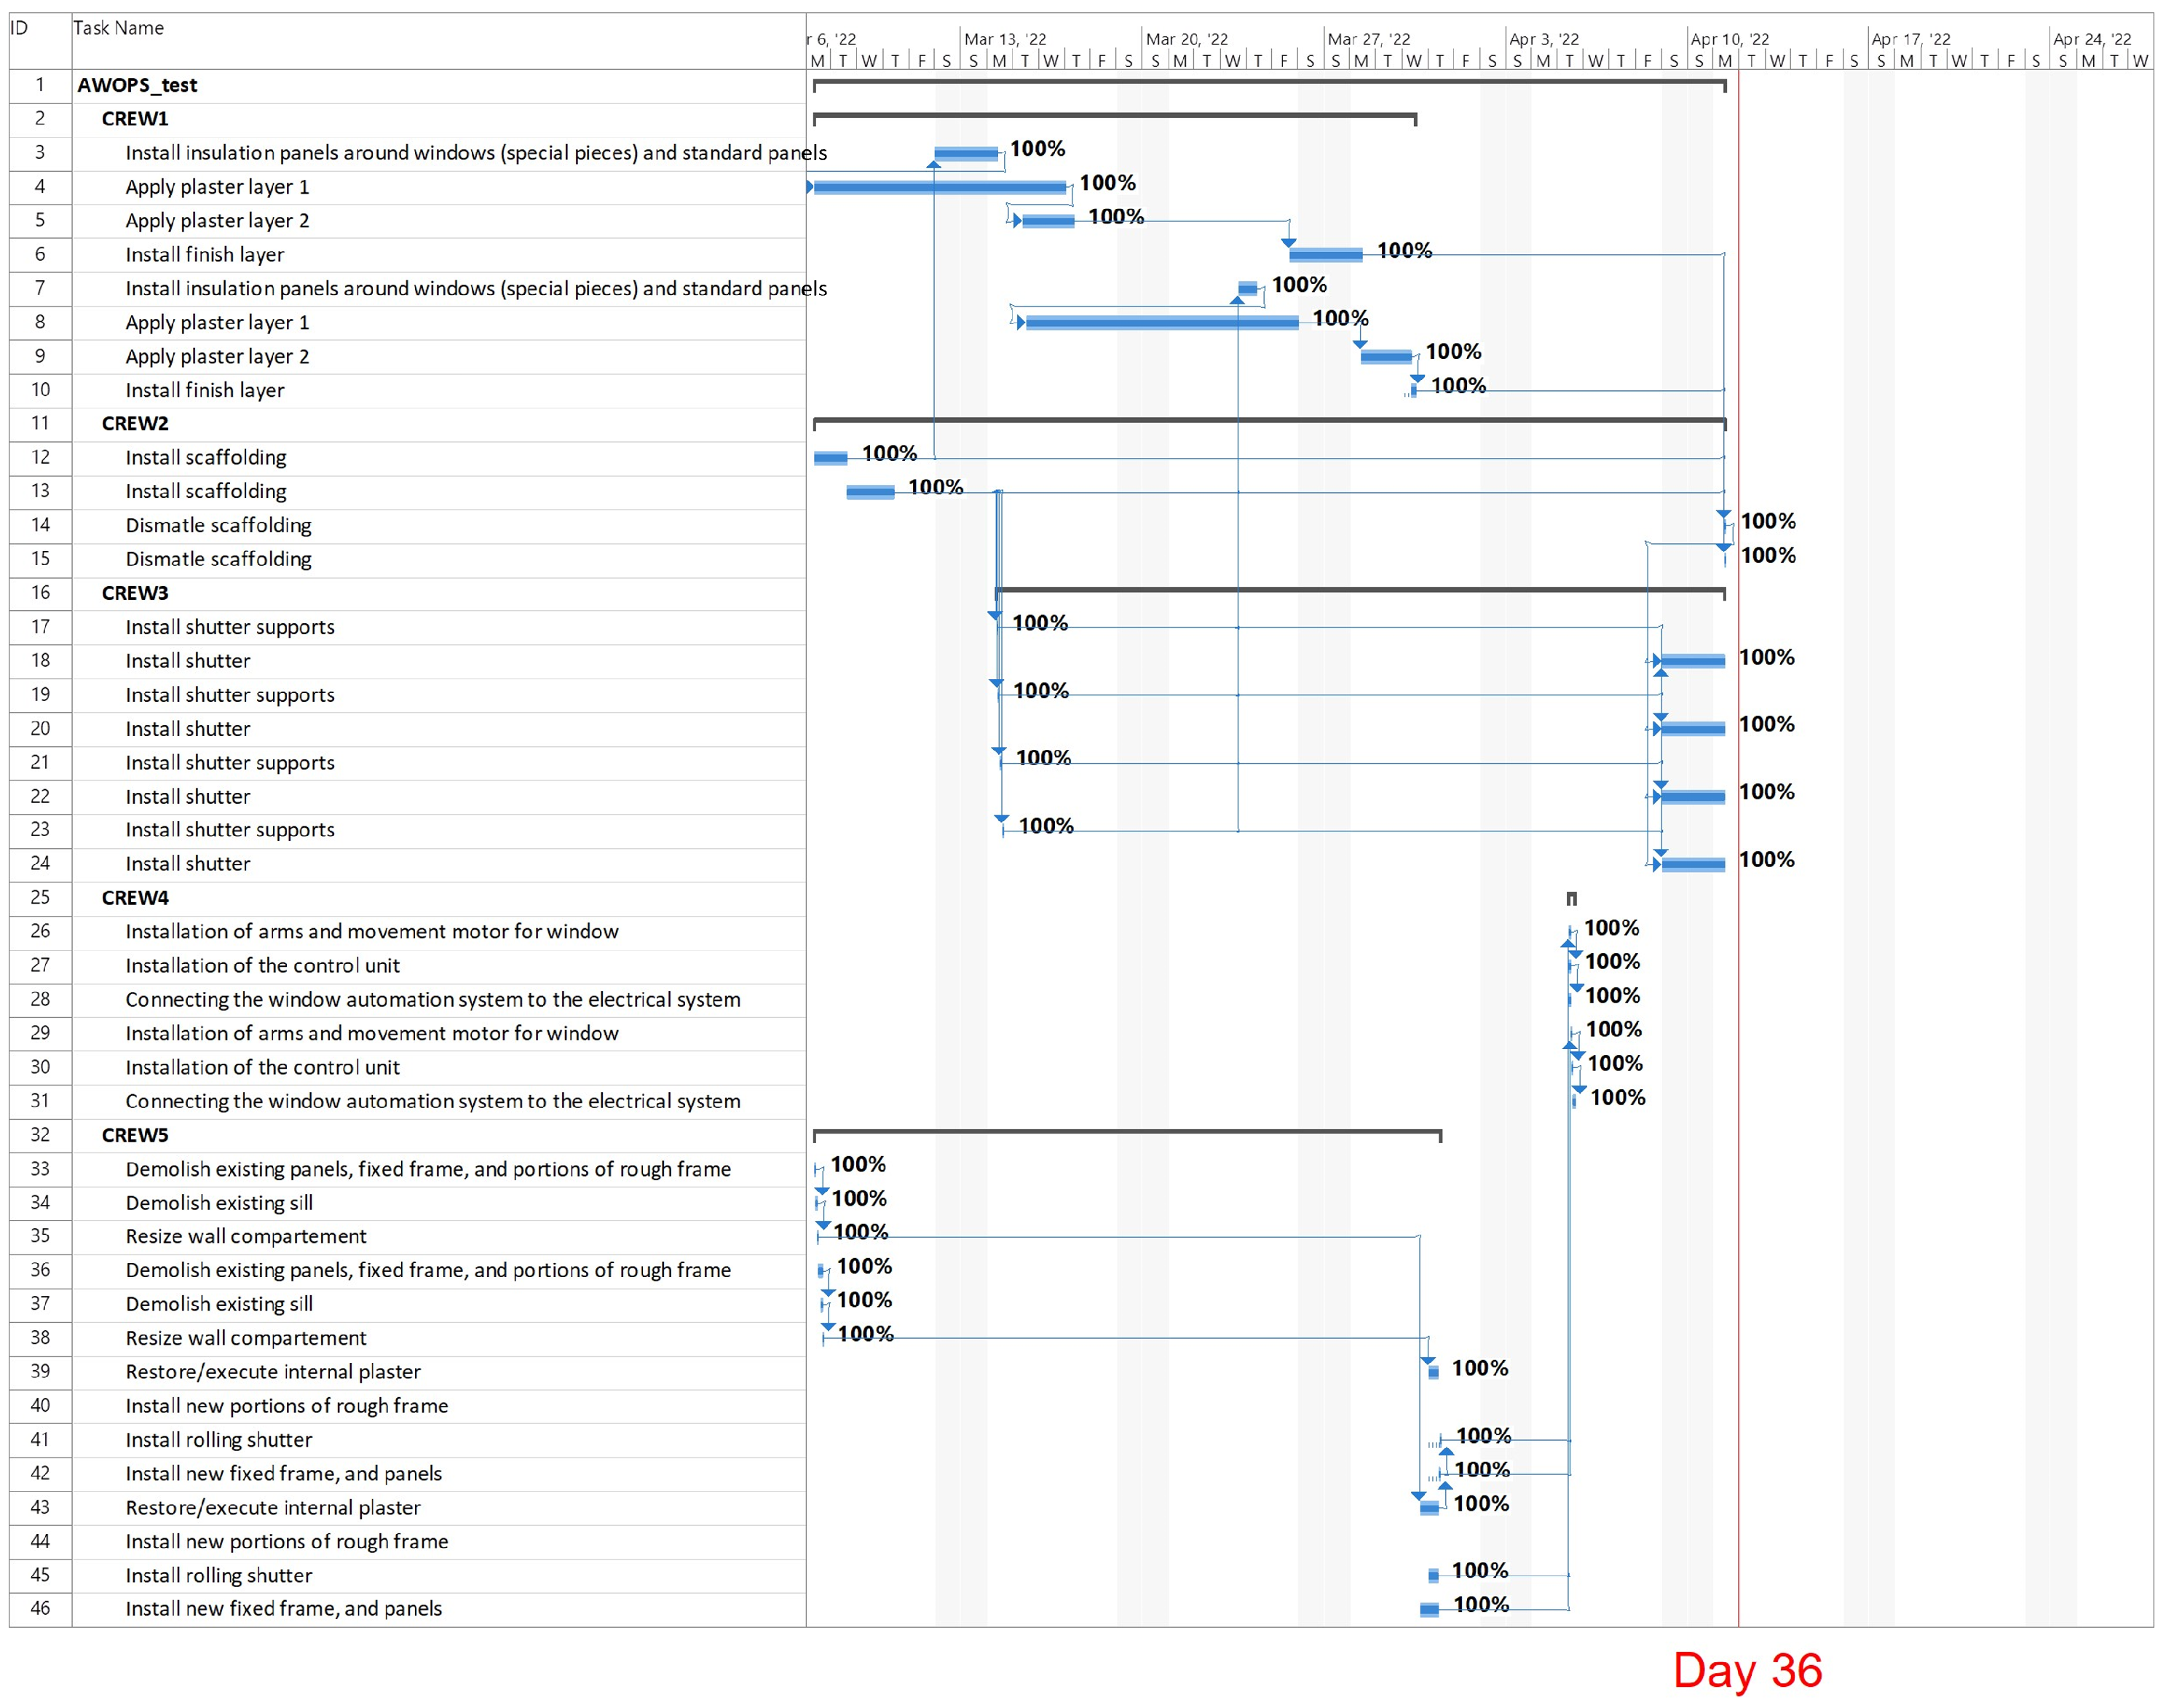
3.2.3. Replanning on Day 32

On day 32 (i.e., 7 April 2022), the supervisor carried out a site inspection to record and input work progress data into AWOPS. Such data, as described for day 8, populate the planner service input file, along with the additional temporal constraints defined by the planner (e.g., project manager/engineer). Following the same procedure described in the previous subsections, the planner starts another simulation of the planning algorithm that generates another workplan (i.e., workplan day 32). Spatial analysis, carried out by SCS for the following 2 days (i.e., days 33 and 34), confirm that the new workplan does not include any spatial interferences. Figure 11 also reports work progress data recorded on day 36 that confirm the completion of renovation works.

3.3. Results of the Assessment

The proposed process-based holonic construction management system, as described in the previous subsections, was tested on-site during energy renovation works carried out in an experimental building located in Cáceres (Spain). In order to assess the viability of the system integrating AWOPS and SCS, several KPIs were measured during experiments, and the collected values are reported in Table 5.
In the planning phase, the first KPI (i.e., A.1), regarding process smoothness to generate and download the schedule, was qualitatively ranked 3 in the Likert scale (i.e., from 1 to 4) (Table 5). This value was estimated by the supervisors answering the question “How smooth is the pipeline to generate and download the schedule?” during the nine replanning actions carried out from 7 March to 11 April 2022. Although there were two supervisors and one field manager involved in renovation activities, the reported value is the one provided by the supervisor who oversaw all the replanning actions for the whole duration of the renovation works.
The second one (i.e., A.2), instead, was calculated based on the cost function that keeps track of the estimated total cost of the renovation works for each replanning action. More specifically, percentage variations of such cost function values from the one corresponding to the baseline (i.e., EUR 14,200), are reported for each replanning in Table 5. The maximum estimated cost increase with reference to the baseline was calculated for the replanning on day 8 (i.e., +3%), whereas the maximum estimated cost decreases were calculated for the replanning on days 29 and 32 (i.e., −20%).
In the monitoring phase, the first KPI (i.e., B.1), indicating the opinion of the supervisor who oversaw all the spatial analysis about the user-friendliness of SCS, was ranked as 1 in the Likert scale (i.e., from 1 to 4) (Table 5). In particular, the opinion reflects how easy it was to resize workspaces to solve spatial interferences among them. The resulting value can be explained by the need to develop a dedicated user-friendly GUI, which is easily accessible to everyone.
The second KPI, relating to the monitoring phase (i.e., B.2), is the percentage of spatial conflicts detected by SCS compared to the maximum number of potential occurrences. In other words, this percentage derives from the ratio between the total number of potential spatial conflicts detected by SCS and the confirmed number of actual real occurrences. With reference to the first workplan on day 0 (i.e., baseline) which corresponds to the worst and most uncertain scenario, a value of 800% was detected (Table 5). In fact, eight potential spatial interferences were detected in total, of which only one was confirmed (Table 3). This means that the SCS overestimates spatial conflicts eight times for the sake of safety.
The third KPI of the same phase (i.e., B.3), indicating the supervisor’s opinion about the ease in updating work progress data within AWOPS, was ranked as 3 in the Likert scale (i.e., from 1 to 4) (Table 5).
Finally, the fourth KPI, relating to the monitoring phase (i.e., B.4), assessing the informative level of the work progress visualization in the execution Web GUI, based on the BPM notation, was ranked as 4 in the Likert scale (i.e., from 1 to 4) (Table 5).

4. Discussion

Experiments were carried out from 7 March 2022 to 11 April 2022 during the renovation work of an experimental building located in Cáceres (Spain). Some considerations about the viability assessment of the proposed holonic process-based construction management system can be made with reference to the KPI values reported in Section 3.3 and in Table 5. The KPI values related to the planning phase indicate how the replanning process, offered by the proposed system, is deemed sufficiently smooth (i.e., KPI A.1, Table 5) and has supported continuous cost estimation refinement (i.e., KPI A.2, Table 5). Regarding this, further studies could investigate identifying factors affecting cost variations in order to control them from the very beginning of the replanning process. Values of KPIs related to the monitoring phase, instead, have shown a very promising contribution in the fields of work progress update (i.e., KPI B.3, Table 5) and visualization (i.e., KPI B.4, Table 5). By contrast, other KPIs in the same domain have underlined possibilities to improve the developed prototype with further studies. In fact, the need to develop a dedicated user-friendly GUI for SCS, which is easily accessible to everyone, has emerged (i.e., KPI B.1, Table 5). Moreover, the fact that SCS has overestimated spatial interferences (i.e., KPI B.2, Table 5) suggests the need to integrate it with a decision support tool that can assist the user in filtering non-relevant spatial interferences.
Overall, it can be stated that the process-based approach experimented in AWOPS can provide several benefits to automatic construction planning, also considering the possibility of supporting continuous replanning during work (i.e., RQ1). In particular, the previous sections reported as replanning actions on day 8 and 32 were successfully fulfilled (Figure 10) based on expert knowledge formalized in BPMN process models during the generation of the baseline on day 0. Indeed, the adopted stigmergic optimization algorithm based on the ACO algorithms was fed for each successive replanning (e.g., on day 8 and 32) by the same BPMN process models defined on day 0 integrated with additional temporal constraints, hence avoiding the tediousness of redefining them from scratch each time. Rescheduling through the use of optimization algorithms like ACO offers significant advantages over traditional project management approaches that do not utilize automated tools. This was reported after testing real-world applications of ACO on different industrial sectors such as transportations, logistics, industrial design optimization and so on [56,57]. In this respect, the AEC industry should be no exception, despite the well-known fragmentation issues and other peculiarities of the latter. ACO, inspired by the behavior of ants in finding the shortest path between their colony and a food source, is particularly effective in identifying optimal or near-optimal solutions to problems in complex and dynamic contexts, such as those encountered in project management. Traditional approaches to rescheduling, often based on the experience and intuition of the project manager, may not be sufficiently quick or accurate in contexts requiring rapid adaptability to unforeseen changes. In contrast, ACO allows for the automatic exploration of a wide range of candidate solutions, considering multiple variables and constraints, to identify effective rescheduling strategies in a reasonably short amount of time. This not only improves the ability to promptly react to changes in the project context but it also optimizes the use of resources, it reduces costs and completion times, and it increases the likelihood of project success overall. Rescheduling through ACO, therefore, offers a systematic and data-driven approach to addressing the challenges of project management, and it very often converges towards the optimal solution even when the problem is characterized by thousands or hundreds of thousands of constraints. The effectiveness of ACO in performing “on-the-fly” rescheduling in very complex scenarios has emerged distinctively in the literature, and the ACO-based solutions were significantly more efficient and less costly than those provided by teams of human analysts based on their sole planning experience [57]. One more advantage of the ACO planning algorithm is that the time it takes to return an optimal or near-optimal planning solution is a quadratic function of the number of tasks and constraints in the plan [56]. This is considered very feasible for computing systems, and thus, despite our experiments being of limited size, the proposed approach scales well towards real-world planning scenarios with hundreds of thousands of tasks and constraints among them.
The integration between AWOPS and SCS, as reported in Table 3, is deemed to be usable to verify whether automatically generated work plans include possible spatial interferences (i.e., RQ2). Furthermore, the holonic feature achieved by framing such integration within a holonic system architecture based on PROSA (i.e., RQ3) has fully emerged during the experiments. In fact, crew leaders, who have a low-level decision strategy, did not deem it necessary to address the only potential spatial interference between deliverables D2 (i.e., window replacement on the north facade) and D3 (i.e., window automation on the north facade) detected on day 0. This is because working day 9 did not affect the short term (Figure 6). In this situation, the planner confirmed the resulting work plan without applying any corrective action. On the contrary, it was necessary for the planner (e.g., project manager/engineer), with their higher-level decision strategy, embodied by the planner (e.g., project manager/engineer), to define the temporal constraints on the replanning actions (Table 2 and Table 4). For example, delays in the delivery of window components required the planner to apply their extensive foresightedness and experience to define tailored constraints. In the results of the experiments, the possibility to trace the aforementioned approach, which prioritizes low-level decisions and delegates higher-level decision entities only where necessary, has proved that the holonic theory was fully implemented and provided the expected contributions.
It must also be clarified that the focus on a modest-sized case study within the context of this paper reflects a pragmatic approach in introducing and evaluating holonic process-based systems based on PROSA integrating ACO algorithms. In fact, one of the goals of this study is to demonstrate that the proposed system, aiming for a more flexible and adaptable management of production processes through the integration of autonomous entities (holons), can be effectively implemented in real-world contexts within the construction industry. This step is crucial to establish the technical and operational feasibility of the proposed model, regardless of its comparative superiority. Hence, this study is a first explanatory example of the proposed holonic system. To assert, instead, that the holonic system based on PROSA surpasses traditional management and planning methods, it would be necessary to examine larger case studies characterized by greater complexity and a higher number of activities. Such analysis would allow for a more in-depth evaluation of the system’s effectiveness in managing complex dynamics and unforeseen changes, providing a detailed comparison with existing alternatives. Thus, the paper aims to demonstrate that, in the presence of problems or unexpected changes, the ACO algorithm integrated into the holonic system is capable of quickly proposing a suboptimal solution. This adaptability and rapid response capability are crucial in dynamic production environments, where conditions can change quickly and require timely interventions. By implementing an ACO algorithm that produces suboptimal solutions in a short amount of time, the approach is expected to be scalable and manageable, even in large construction sites with multiple activities. The prospect of maintaining low computational costs while addressing more complex problems underscores the potential of the holonic system based on PROSA and ACO for large-scale applications. In addition, in the case of large-scale projects, the proposed system would benefit from the process-based approach, introducing a smoother data flow between construction knowledge formalized by process models and ACO replanning algorithms [19,20]. This research approach offers a significant contribution to the field of productive systems management, laying the groundwork for future studies that can confirm and expand the results obtained, highlighting the potential of this integration between holonic theory and optimization algorithms in solving complex challenges and improving operational efficiency.

5. Conclusions

In the AEC industry, many efforts have been made in the construction replanning process. Despite the remarkable contributions offered across decades, some challenges still remain. An extended analysis of the state of the art has drawn attention to the complex nature of the construction sector. The complexity of the AEC industry helps to explain the very frequent coordination and communication problems affecting construction project stakeholders, as well as difficulties in prompt replanning actions aimed to address unexpected events. In the complex domain, the manufacturing industry has already taken the first steps by proposing the holonic approach as one of the possible strategies. In particular, conceptual architecture for manufacturing control, called PROSA, has provided promising results in facing complexity and ensuring reliability when dealing with the unexpected.
This study has applied the holonic approach formalized in PROSA to address complexity inherent to the construction sector. This attempt, which started with an analysis of differences between the construction and the manufacturing domains, has drawn attention to a more fragmented and spatially dynamic nature of the AEC industry. The shift to a process-based approach has been identified as a possible solution to solve construction fragmentation, whereas spatial analysis can provide significant contributions in managing the dynamic demand of space on construction sites. Given this premise, the three research questions, formalized to set out the directives of this study, declare the need to dig deep into integrating process models, automatic replanning, and spatial analysis and to assess the viability of a holonic framework based on PROSA, which includes all three features. To answer these questions, a prototype of the proposed system, consisting of the combination of AWOPS and SCS, was developed and tested on-site during real energy renovation works.
Experiments, carried out from 7 March 2022 to 11 April 2022 on an experimental building located in Cáceres (Spain), proved that the process-based approach experimented in AWOPS can provide several benefits to automatic construction planning, also considering the possibility of supporting continuous replanning during work (i.e., RQ1). The integration between AWOPS and SCS has proved to be useful to verify whether automatically generated work plans include possible spatial interferences (i.e., RQ2). Such integration between AWOPS and SCS has been framed within a holonic system architecture defined by mapping actors involved in the use case in question into the four types of holons defined in PROSA (i.e., RQ3). To the best of the authors’ knowledge, on-site tests of the developed prototype represent the very first experimentation of PROSA on a real construction site. The capability of the system to react to the unexpected has been stressed by nine replanning actions, proving that such a reference architecture can also provide valuable results in the construction domain.
To sum up, several improvements have resulted from the application of the proposed holonic process-based construction management system with respect to traditional ones. At least three key advancements have been registered due to the integration of the holonic- and process-based paradigms. The process-based paradigm (i) has enabled formalizing construction knowledge into machine-readable process models and defining inputs for automatic replanning. Process models can be stored into libraries and reused in the same or different construction projects avoiding the burden of redefining them from scratch. In addition, automated generated workplans, before being delivered to the construction site, (ii) are spatially checked in order to detect eventual spatial issues. Finally, the holonic-based approach (iii) prioritizes issues resolution at a low level among crew leaders (i.e., low-level decisions), asking for project manager intervention at a high level (i.e., high-level decision) only if necessary.
Limitations and further research directions can be summarized as follows. The first one regards the demonstration of feasibility versus superiority of the proposed holonic process-based system. While the current study successfully demonstrates its feasibility, proving the superiority of the proposed system over traditional systems would require testing on more complex construction projects that include a greater number of activities. The second limitation refers to the fact that, to resolve potential spatial conflicts, project managers must rely on their experience. They must introduce, based on past experience, constraints on activities and/or processes they expect could resolve the conflict. It would be beneficial to provide project managers with a tool that guides them in choosing possible mitigating actions that can resolve the conflict. Furthermore, in this context, project managers could benefit from tools that help them in quantifying the cost implications of any introduced mitigating actions. Lastly, as indicated by the KPI values related to the monitoring phase, it would be useful in the future to have a user-friendly GUI that facilitates the resolution of spatial conflicts through low-level decisions made by crew leaders. Such a GUI would streamline the decision-making process, potentially reducing the time and effort required to address conflicts and improving overall project efficiency. These limitations underscore areas for future development and research. Enhancing the holonic system with tools for better decision support and conflict resolution, and expanding the scope of testing to more complex projects could significantly strengthen the case for the superiority of process-based holonic systems in construction project management.

Author Contributions

Conceptualization, A.C. and B.N.; Methodology, L.M., A.C., F.S., M.V. and B.N.; Software, F.S. and M.V.; Validation, L.M. and A.C.; Resources, C.F.; Data curation, L.M.; Writing—original draft, L.M.; Writing—review & editing, L.M., A.C., F.S. and M.V.; Supervision, A.C. and B.N.; Project administration, A.C.; Funding acquisition, A.C. All authors have read and agreed to the published version of the manuscript.

Funding

This work was partially supported by the European Commission under the program H2020, ENCORE Project—“Energy aware BIM Cloud Platform in a Cost-effective Building Renovation Context”, Grant Agreement No. 820434.

Informed Consent Statement

Informed consent was obtained from all subjects involved in the study.

Data Availability Statement

Some or all data, models, or code generated or used during the study are available in a repository online in accordance with funder data retention policies [55]. It must be noted that the numbering of days in the data available online at the provided links is different from the one adopted in this paper. In fact, day 1 in the data available online corresponds to 13 March 2022, that is, day 7, in this paper.

Conflicts of Interest

The authors declare no conflicts of interest.

References

  1. Sacks, R.; Radosavljevic, M.; Barak, R. Requirements for building information modeling based lean production management systems for construction. Autom. Constr. 2010, 19, 641–655. [Google Scholar] [CrossRef]
  2. Zhou, W.; Zhao, T.; Liu, W.; Tang, J. Tower crane safety on construction sites: A complex sociotechnical system perspective. Saf. Sci. 2018, 109, 95–108. [Google Scholar] [CrossRef]
  3. Dallasega, P.; Marengo, E.; Revolti, A. Strengths and shortcomings of methodologies for production planning and control of construction projects: A systematic literature review and future perspectives. Prod. Plan. Control. 2021, 32, 257–282. [Google Scholar] [CrossRef]
  4. Gorod, A.; Hallo, L.; Statsenko, L.; Nguyen, T.; Chileshe, N. Integrating hierarchical and network centric management approaches in construction megaprojects using a holonic methodology. Eng. Constr. Archit. Manag. 2021, 28, 627–661. [Google Scholar] [CrossRef]
  5. Cilliers, P. Complexity & Postmodernism; Routledge: London, UK, 1998. [Google Scholar] [CrossRef]
  6. Garcia-Lopez, N.P.; Fischer, M. A Construction Workflow Model for Analyzing the Impact of In-Project Variability. In Construction Research Congress 2016: Old and New Construction Technologies Converge in Historic San Juan—Proceedings of the 2016 Construction Research Congress, San Juan, Puerto Rico, 31 May–2 June 2016; ASCE Library: Reston, VA, USA, 2016; pp. 1998–2007. [Google Scholar] [CrossRef]
  7. Grau, D.; Abbaszadegan, A.; Assanair, R. Process versus operations workflow—Making the case for continuous monitoring of construction operations. In Proceedings of the 27th Annual Conference of the International Group for Lean Construction, IGLC 2019, Dublin, Ireland, 3–5 July 2019; pp. 563–572. [Google Scholar] [CrossRef]
  8. Van Brussel, H.; Wyns, J.; Valckenaers, P.; Bongaerts, L.; Peeters, P. Reference architecture for holonic manufacturing systems: PROSA. Comput. Ind. 1998, 37, 255–274. [Google Scholar] [CrossRef]
  9. Ma, H.; Zhang, H.; Chang, P. 4D-Based Workspace Conflict Detection in Prefabricated Building Constructions. J. Constr. Eng. Manag. 2020, 146, 04020112. [Google Scholar] [CrossRef]
  10. Kim, M.; Ji, S.; Jun, H. BIM-based file synchronization and permission management system for architectural design collaboration. J. Asian Archit. Build. Eng. 2017, 16, 511–518. [Google Scholar] [CrossRef]
  11. Redwood, J.; Thelning, S.; Elmualim, A.; Pullen, S. The Proliferation of ICT and Digital Technology Systems and their Influence on the Dynamic Capabilities of Construction Firms. Procedia Eng. 2017, 180, 804–811. [Google Scholar] [CrossRef]
  12. Dallasega, P.; Revolti, A.; Follini, C.; Schimanski, C.P.; Matt, D.T. BIM-based construction progress measurement of non-repetitive HVAC installation works. In Proceedings of the 27th Annual Conference of the International Group for Lean Construction, IGLC 2019, Dublin, Ireland, 3–5 July; pp. 819–830. [CrossRef]
  13. Hyun, B.; Choo, J.; Tommelein, I.D.; Member, A.; Ballard, G.; Zabelle, T.R. WorkPlan: Constraint-based database for work package scheduling. Engineering 1999, 125, 151–161. [Google Scholar]
  14. Koerckel, A.; Ballard, G. Return on investment in construction innovation—A lean construction case study. In Proceedings of the 13th International Group for Lean Construction Conference, Sydney, Australia, 19–21 July 2005; pp. 91–98. [Google Scholar]
  15. Sriprasert, E.; Dawood, N. Multi-constraint information management and visualisation for collaborative planning and control in construction. Electron. J. Inf. Technol. Constr. 2003, 8, 341–366. [Google Scholar]
  16. Schimanski, C.P.; Pradhan, N.L.; Chaltsev, D.; Pasetti Monizza, G.; Matt, D.T. Integrating BIM with Lean Construction approach: Functional requirements and production management software. Autom. Constr. 2021, 132, 103969. [Google Scholar] [CrossRef]
  17. Heigermoser, D.; García de Soto, B.; Abbott, E.L.S.; Chua, D.K.H. BIM-based Last Planner System tool for improving construction project management. Autom. Constr. 2019, 104, 246–254. [Google Scholar] [CrossRef]
  18. Lin, J.J.; Golparvar-Fard, M. Visual and Virtual Production Management System for Proactive Project Controls. J. Constr. Eng. Manag. 2021, 147, 1–17. [Google Scholar] [CrossRef]
  19. Ismail, A.; Scherer, R. Integration of Simulation Data For Construction Project Planning Using a Process-based Simulation Framework-(Best Paper Award) Mefisto View project wiSIB-A Simulation and Knowledge-Based System Identification Approach for Bridge Structures View project IN. In Proceedings of the 13th International Conference on Modeling and Applied Simulation- MAS, Bordeaux, France, 10–12 September 2014. [Google Scholar] [CrossRef]
  20. Ismail, A.; Srewil, Y.; Scherer, R.J. Integrated and collaborative process-based simulation framework for construction project planning. J. Simul. Process. Model. 2017, 12, 42–53. [Google Scholar] [CrossRef]
  21. Autodesk Inc. Autodesk BIM 360; Autodesk Inc.: San Francisco, CA, USA, 2024; Available online: https://www.autodesk.com/bim-360/ (accessed on 6 February 2024).
  22. Drees & Sommer. LCM Digital. Available online: https://lcmdigital.com/en/ (accessed on 6 February 2024).
  23. Bayhan, H.G.; Demirkesen, S.; Zhang, C.; Tezel, A. A lean construction and BIM interaction model for the construction industry. Prod. Plan. Control. 2021, 1–28. [Google Scholar] [CrossRef]
  24. Microsoft Microsoft Excel. 2024. Available online: https://www.microsoft.com/it-it/microsoft-365/excel?market=it (accessed on 6 February 2024).
  25. Bascoul, A.M.; Tommelein, I.D.; Douthett, D. Visual Management of Daily Construction Site Space Use. Front. Built Environ. 2020, 6, 139. [Google Scholar] [CrossRef]
  26. Francis, A. Chronographical Site-Spatial-Temporal Modeling of Construction Operations. Front. Built Environ. 2020, 6, 1–9. [Google Scholar] [CrossRef]
  27. Getuli, V.; Capone, P.; Bruttini, A.; Isaac, S. BIM-based immersive Virtual Reality for construction workspace planning: A safety-oriented approach. Autom. Constr. 2020, 114, 103160. [Google Scholar] [CrossRef]
  28. Kassem, M.; Dawood, N.; Chavada, R. Construction workspace management within an Industry Foundation Class-Compliant 4D tool. Autom. Constr. 2015, 52, 42–58. [Google Scholar] [CrossRef]
  29. Messi, L.; García de Soto, B.; Carbonari, A.; Naticchia, B. Spatial conflict simulator using game engine technology and Bayesian networks for workspace management. Autom. Constr. 2022, 144, 104596. [Google Scholar] [CrossRef]
  30. Chen, C.; Tang, L. BIM-based integrated management workflow design for schedule and cost planning of building fabric maintenance. Autom. Constr. 2019, 107, 102944. [Google Scholar] [CrossRef]
  31. Nechyporchuk, Y.; Bašková, R. The conformity of the tools of selected software programs for 4D building modeling. Iop Conf. Ser. Mater. Sci. Eng. 2020, 867, 012034. [Google Scholar] [CrossRef]
  32. SYNCHRO Construction. Using Synchro PRO for Workspace Clash Detection. 2015. Available online: https://www.youtube.com/watch?v=0hDcb9aeUPE&t=6s (accessed on 6 February 2024).
  33. Leveson, N. A new accident model for engineering safer systems. Saf. Sci. 2004, 42, 237–270. [Google Scholar] [CrossRef]
  34. Mansouri, M.; Gorod, A.; Sauser, B.; Gandhi, S.J. A systemic approach to adopting effective management styles based on typology of systems. In Proceedings of the 30th Annual National Conference of the American Society for Engineering Management, Springfield, MO, USA, 14–17 October 2009; American Society for Engineering Management (ASEM): Huntsville, AL, USA, 2009; pp. 588–596. [Google Scholar]
  35. Koestler, A. The Ghost in the Machine; The Macmillan Company: Hutchinson, KS, USA, 1967. [Google Scholar]
  36. Valckenaers, P.; Van Brussel, H. Design for the Unexpected: From Holonic Manufacturing Systems Towards a Humane Mechatronics Society; Butterworth-Heinemann: Oxford, UK, 2015; pp. 1–218. [Google Scholar] [CrossRef]
  37. Giret, A.; Botti, V. Holons and agents. J. Intell. Manuf. 2004, 15, 645–659. [Google Scholar] [CrossRef]
  38. Verstraete, P.; Saint Germain, B.; Hadeli, K.; Valckenaers, P.; Van Brussel, H. On applying the PROSA reference architecture in multi-agent manufacturing control applications. In Multi-Agent Systems and Software Architecture Special Track at Net. ObjectDays; Katholieke Universiteit Leuven: Heverlee, Belgium, 2006; pp. 31–47. [Google Scholar]
  39. Hirose, M.; Ischii, T.; Ikei, Y. Development of the Holonic Manipulator. Proc. Technol. 1986, 91–96. [Google Scholar]
  40. Hirose, M.; Ischii, T.; Ikei, Y.; Amari, H. Software environment for holonic manipulator. Adv. Flex. Autom. Robot. 1988, 1, 317–324. [Google Scholar]
  41. Hirose, M. Development of the holonic manipulator and its control. Proc. IEEE Conf. Decis. Control. 1990, 1, 91–96. [Google Scholar] [CrossRef]
  42. Babiceanu, R.F.; Chen, F.F. Development and applications of holonic manufacturing systems: A survey. J. Intell. Manuf. 2006, 17, 111–131. [Google Scholar] [CrossRef]
  43. Liu, S.; Gruver, W.A.; Kotak, D.; Bardi, S. Holonic manufacturing system for distributed control of automated guided vehicles. In Proceedings of the IEEE International Conference on Systems, Man and Cybernetics, Nashville, TN, USA, 8–11 October 2000; Volume 3, pp. 1727–1732. [Google Scholar] [CrossRef]
  44. Brückner, S.; Wyns, J. Designing Agents for Manufacturing Control. 1998. Available online: https://aaai.org/papers/sigman98-006-designing-agents-for-manufacturing-control/ (accessed on 6 February 2024).
  45. Pascal, C.; Panescu, D. On rescheduling in holonic manufacturing systems. Comput. Ind. 2019, 104, 34–46. [Google Scholar] [CrossRef]
  46. Zekavat, P.R.; Moon, S.; Bernold, L.E. Holonic Construction Management: Unified Framework for ICT-Supported Process Control. J. Manag. Eng. 2015, 31, 1–15. [Google Scholar] [CrossRef]
  47. Naticchia, B.; Carbonari, A.; Vaccarini, M.; Giorgi, R. Holonic execution system for real-time construction management. Autom. Constr. 2019, 104, 179–196. [Google Scholar] [CrossRef]
  48. Amer, F.; Koh, H.Y.; Golparvar-Fard, M. Automated Methods and Systems for Construction Planning and Scheduling: Critical Review of Three Decades of Research. J. Constr. Eng. Manag. 2021, 147, 03121002. [Google Scholar] [CrossRef]
  49. Messi, L.; Spegni, F.; Carbonari, A.; Ridolfi, L.; Vaccarini, M. Process-based simulation models construction management at runtime using BPMN for construction management at runtime. In Proceedings of the CIBW78-LDAC Conference, Luxembourg, 11–15 October 2021. [Google Scholar]
  50. Naticchia, B.; Messi, L.; Carbonari, A. BIM-based Holonic System for Real-Time Pathfinding in Building Emergency Scenario. In Proceedings of the 2019 European Conference for Computing in Construction, Crete, Greece, 10–12 July 2019; Volume 1, pp. 117–124. [Google Scholar] [CrossRef]
  51. Gambardella, L.M.; Taillard, E.; Agazzi, G. MACS-VRPTW: A Multiple Ant Colony System for Vehicle Routing Problems with Time Windows. In New Ideas in Optimization Chapter 5; Corne, D., Dorigo, M., Glover, F., Eds.; McGraw-Hill: London, UK, 1999; pp. 1–17. [Google Scholar]
  52. IfcOpenShell Contributors. IfcOpenShell BIMserver Plugin. 2020. Available online: https://github.com/opensourceBIM/IfcOpenShell-BIMserver-plugin (accessed on 6 February 2024).
  53. The MathWorks Inc. MATLAB. 2024. Available online: https://it.mathworks.com/products/matlab.html (accessed on 6 February 2024).
  54. Microsoft Microsoft Project. 2024. Available online: https://www.microsoft.com/en-us/microsoft-365/project/project-management-software (accessed on 6 February 2024).
  55. Messi, L.; Carbonari, A. Data Repository about AWOPS Testing: Workplans Generated during AWOPS Tests. 2022. Available online: https://zenodo.org/records/6546630 (accessed on 6 February 2024).
  56. Dorigo, M.; Maniezzo, V.; Colorni, A. Ant System: Optimization by a Colony of Cooperating Agents. IEEE Trans. Syst. Man Cybern. Part B 1996, 26, 29–41. [Google Scholar]
  57. Rizzoli, A.E.; Montemanni, R.; Lucibello, E.; Gambardella, L.M. Ant colony optimization for real-world vehicle routing problems. Swarm Intell. 2007, 1, 135–151. [Google Scholar] [CrossRef]
Figure 1. Concept of the proposed holonic process-based construction management system.
Sustainability 16 01824 g001
Figure 2. Mapping between PROSA architecture and the holarchy of the proposed holonic process-based construction management system. (a) PROSA architecture adapted from [36]; (b) PROSA-based holarchy of the proposed system.
Sustainability 16 01824 g002
Figure 3. System architecture of the proposed holonic process-based construction management system.
Sustainability 16 01824 g003
Figure 4. Web GUI of AWOPS. (a) Project initialization Web GUI (i.e., called “Setup”) of AWOPS. (b) Deliverables definition Web GUI (i.e., called “Deliverables”) of AWOPS. (c) Processes definition Web GUI (i.e., called “Processes”) of AWOPS. (d) Activities definition Web GUI (i.e., called “Activities”) of AWOPS. (e) Crews definition Web GUI (i.e., called “Crews”) of AWOPS. (f) Baseline generation Web GUI (i.e., called “Workplan”) of AWOPS (continued).
Sustainability 16 01824 g004aSustainability 16 01824 g004b
Figure 5. Phases of the proposed replanning workflow based on AWOPS.
Sustainability 16 01824 g005
Figure 6. UI of the spatial conflicts simulator (SCS), developed within the Unity3DTM, displaying the spatial analysis results of the workplan generated on day 0 (i.e., baseline) for the working day 9.
Sustainability 16 01824 g006
Figure 7. Views of the existing and new construction phases of building adopted as the use case. (a) Northeast view of the existing phase. (b) Southwest view of the existing phase. (c) Northeast view of the new construction phase. (d) Southwest view of the new construction phase.
Sustainability 16 01824 g007
Figure 8. Workplan generated on day 0 (i.e., baseline) with work progress data collected on day 8.
Sustainability 16 01824 g008
Figure 9. Execution Web GUI (i.e., called “Execution”) of AWOPS reporting the construction site status. (a) Work progress of deliverable D1 (i.e., window replacement on north facade) on day 8 displayed on the process model (left) matching the construction site status (right). (b) Work progress of deliverable D5 (i.e., window replacement on north facade) on day 8 displayed on the process model (left) matching the construction site status (right).
Sustainability 16 01824 g009
Figure 10. Workplan generated on day 8 (i.e., light blue bars) compared to the one generated on day 0 (i.e., grey bars).
Sustainability 16 01824 g010
Figure 11. Workplan generated on day 32 (i.e., light blue bars) with work progress data collected on day 36.
Sustainability 16 01824 g011
Table 1. Overview of experiments.
DateDay No.Day TypeAction
6 March 20220Non-working dayGeneration of the
baseline
7 March 20221Working dayBeginning of work
8 March 20222Working day
9 March 20223Working day
10 March 20224Working day
11 March 20225Working day
12 March 20226Non-working day
12 March 20227Non-working day
14 March 20228Working dayUpdate of work
progress, replanning
15 March 20229Working day
16 March 202210Working day
17 March 202211Working dayUpdate of work
progress, replanning
18 March 202212Working day
19 March 202213Non-working day
20 March 202214Non-working day
21 March 202215Working dayUpdate of work
progress, replanning
22 March 202216Working day
23 March 202217Working day
24 March 202218Working dayUpdate of work
progress, replanning
25 March 202219Working day
26 March 202220Non-working day
27 March 202221Non-working day
28 March 202222Working dayUpdate of work
progress, replanning
29 March 202223Working day
30 March 202224Working day
31 March 202225Working dayUpdate of work
progress, replanning
1 April 202226Working day
2 April 202227Non-working day
3 April 202228Non-working day
4 April 202229Working dayUpdate of work
progress, replanning
5 April 202230Working day
6 April 202231Working day
7 April 202232Working dayUpdate of work
progress, replanning
8 April 202233Working day
9 April 202234Non-working day
10 April 202235Non-working day
11 April 202236Working dayUpdate of work
progress, end of work
Table 2. Temporal constraints applied during the generation of the baseline on day 0.
IDNameStart Date/TimeDue Date/TimeReason
4Install insulation
panels around
windows
(special pieces)
and standard
panels
14 March 202231 December 2022Internal
organization
8Install insulation
panels around
windows
(special pieces)
and standard
panels
14 March 202231 December 2022Internal
organization
14Install shutter
supports
14 March 202231 December 2022Internal
organization
16Install shutter
supports
14 March 202231 December 2022Internal
organization
18Install shutter
supports
14 March 202231 December 2022Internal
organization
20Install shutter
supports
14 March 202231 December 2022Internal
organization
21Installation of
arms and
movement
motor for
windows
14 March 202231 December 2022Internal
organization
24Installation of
arms and
movement
motor for
windows
14 March 202231 December 2022Internal
organization
31Restore/put in
internal plaster
14 March 202231 December 2022Internal
organization
38Restore/put in
internal plaster
14 March 202231 December 2022Internal
organization
Table 3. Results of spatial analysis carried out by SCS for the workplan generated on day 0 (e.g., baseline) and for days from 14 to 17 March 2022. The spatial conflict between deliverables D2 and D3 is the only one that represents a potential conflict. No interferences were detected for the other days.
DateDay No.Day TypePotential Interferences
No.
Involved DeliverablesConfirmed Interferences
No.
..................
14 March 20228Working day2D1–D5, D2–D50
15 March 20229Working day3D2–D5, D3–D5,
D2–D3
1
16 March 202210Working day2D4–D5, D3–D50
17 March 202211Working day1D4–D50
..................
Table 4. Temporal constraints applied during the generation of the workplan on day 8.
IDNameStart Date/TimeDue Date/TimeReason
8Install insulation
panels around
windows (special
pieces) and
standard panels
21 March 202231 December 2022Internal
organization
21Installation of
arms and
movement motor
for windows
14 March 202231 December 2022Internal
organization
24Installation of
arms and
movement motor
for windows
14 March 202231 December 2022Internal
organization
30Install new fixed
frame, and panels
18 March 202231 December 2022Truck drivers’
strike
37Install new fixed
frame, and panels
18 March 202231 December 2022Truck drivers’
strike
32Install rolling
shutters
18 March 202231 December 2022Truck drivers’
strike
39Install rolling
shutters
18 March 202231 December 2022Truck drivers’
strike
Table 5. KPI values measured during experiments.
IDNameDescriptionUnitValue
A.1Process
smoothness
How smooth is the
pipeline to
generate and
download the
schedule?
Likert (i.e., from 1 to 4)3
A.2Cost trackingVariation of the
cost function
values for the
totality of works
from the baseline
%0 (day 0)
+3 (day 8)
−13 (day 11)
−11 (day 15)
−9 (day 18)
−17 (day 22)
−19 (day 25)
−20 (day 29)
−20 (day 32)
B.1Clash fixingWere crew leaders
able to resize
workspaces and
solve clashes
locally in the SCS?
Likert (i.e., from 1 to 4)1
B.2Detectability of
spatial conflicts
Ratio between the
number of spatial
conflicts detected
by SCS and the
maximum number
of potential
occurrences
%800
B.3Work progress
update
How easy is the
update of work
progress in the
web service?
Likert (i.e., from 1 to 4)3
B.4Work progress
visualization
How informative
is the visualization
of the work
progress in the
web service?
Likert (i.e., from 1 to 4)4
Disclaimer/Publisher’s Note: The statements, opinions and data contained in all publications are solely those of the individual author(s) and contributor(s) and not of MDPI and/or the editor(s). MDPI and/or the editor(s) disclaim responsibility for any injury to people or property resulting from any ideas, methods, instructions or products referred to in the content.

